ETC1010: Introduction to Data Analysis
Week 10, part B
Classification Trees
Lecturer: Professer Di Cook & Nicholas Tierney & Stuart Lee
Department of Econometrics and Business Statistics
nicholas.tierney@monash.edu
May 2020
Press the right arrow to progress to the next slide!
Lecturer: Professer Di Cook & Nicholas Tierney & Stuart Lee
Department of Econometrics and Business Statistics
nicholas.tierney@monash.edu
May 2020
Tree based models consist of one or more of nested if-then statements for the predictors that partition the data. Within these partitions, a model is used to predict the outcome.

Source: Egor Dezhic
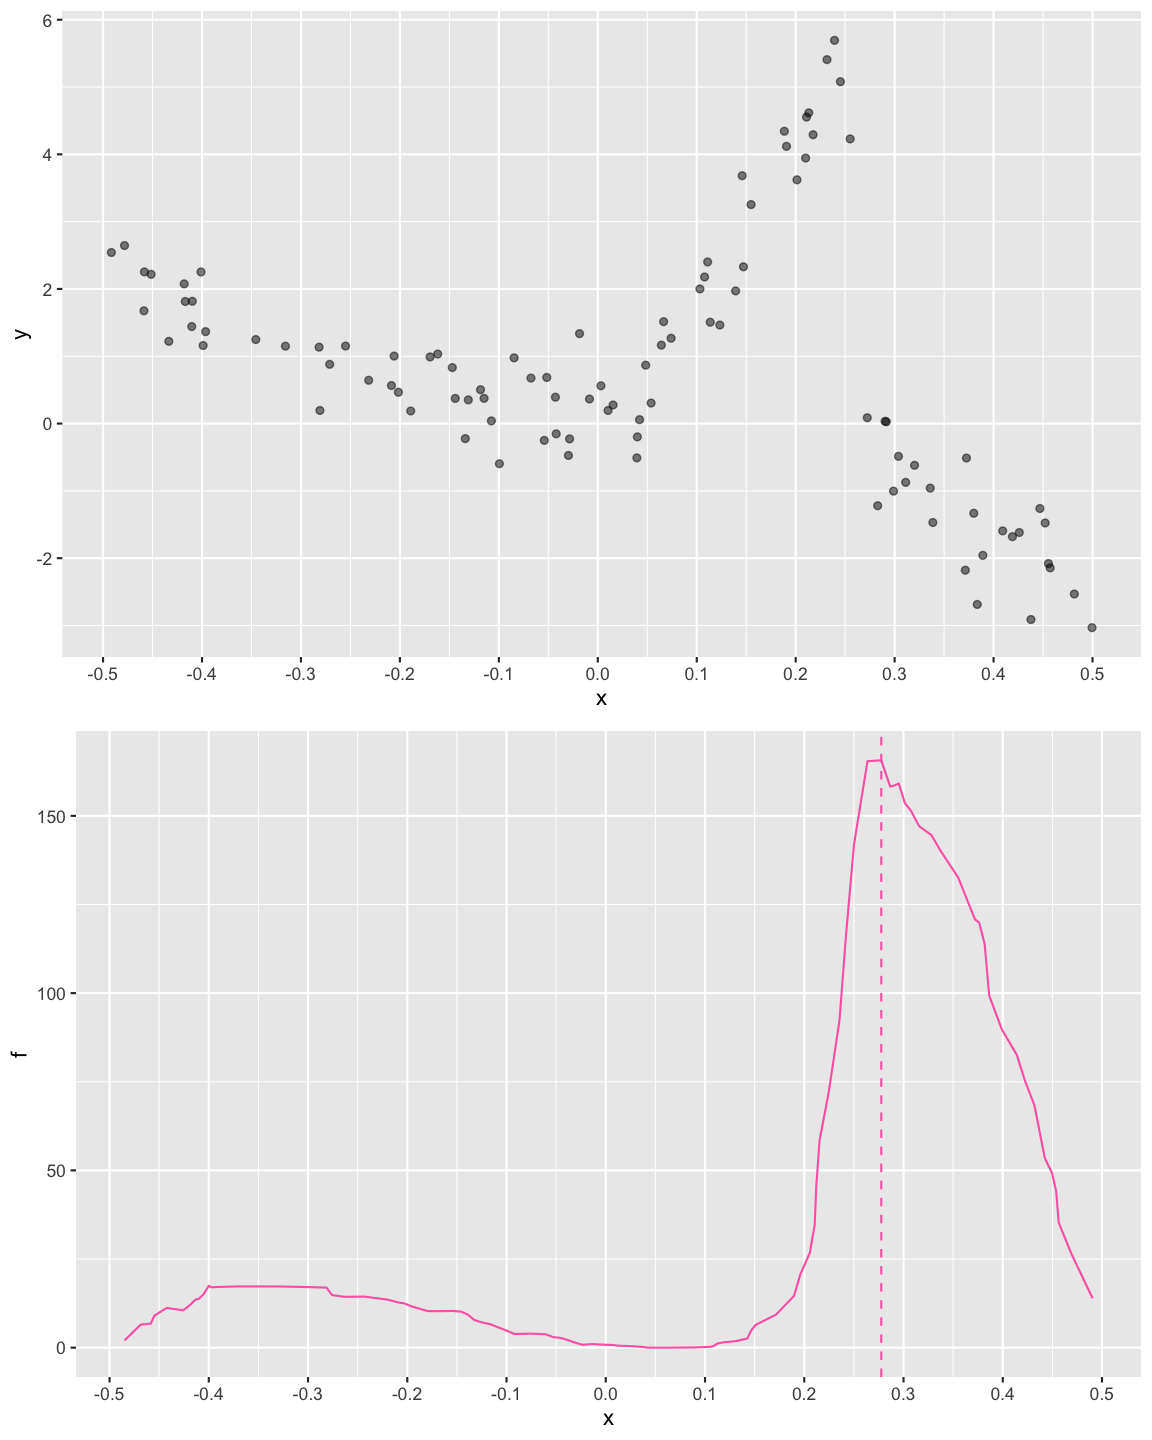
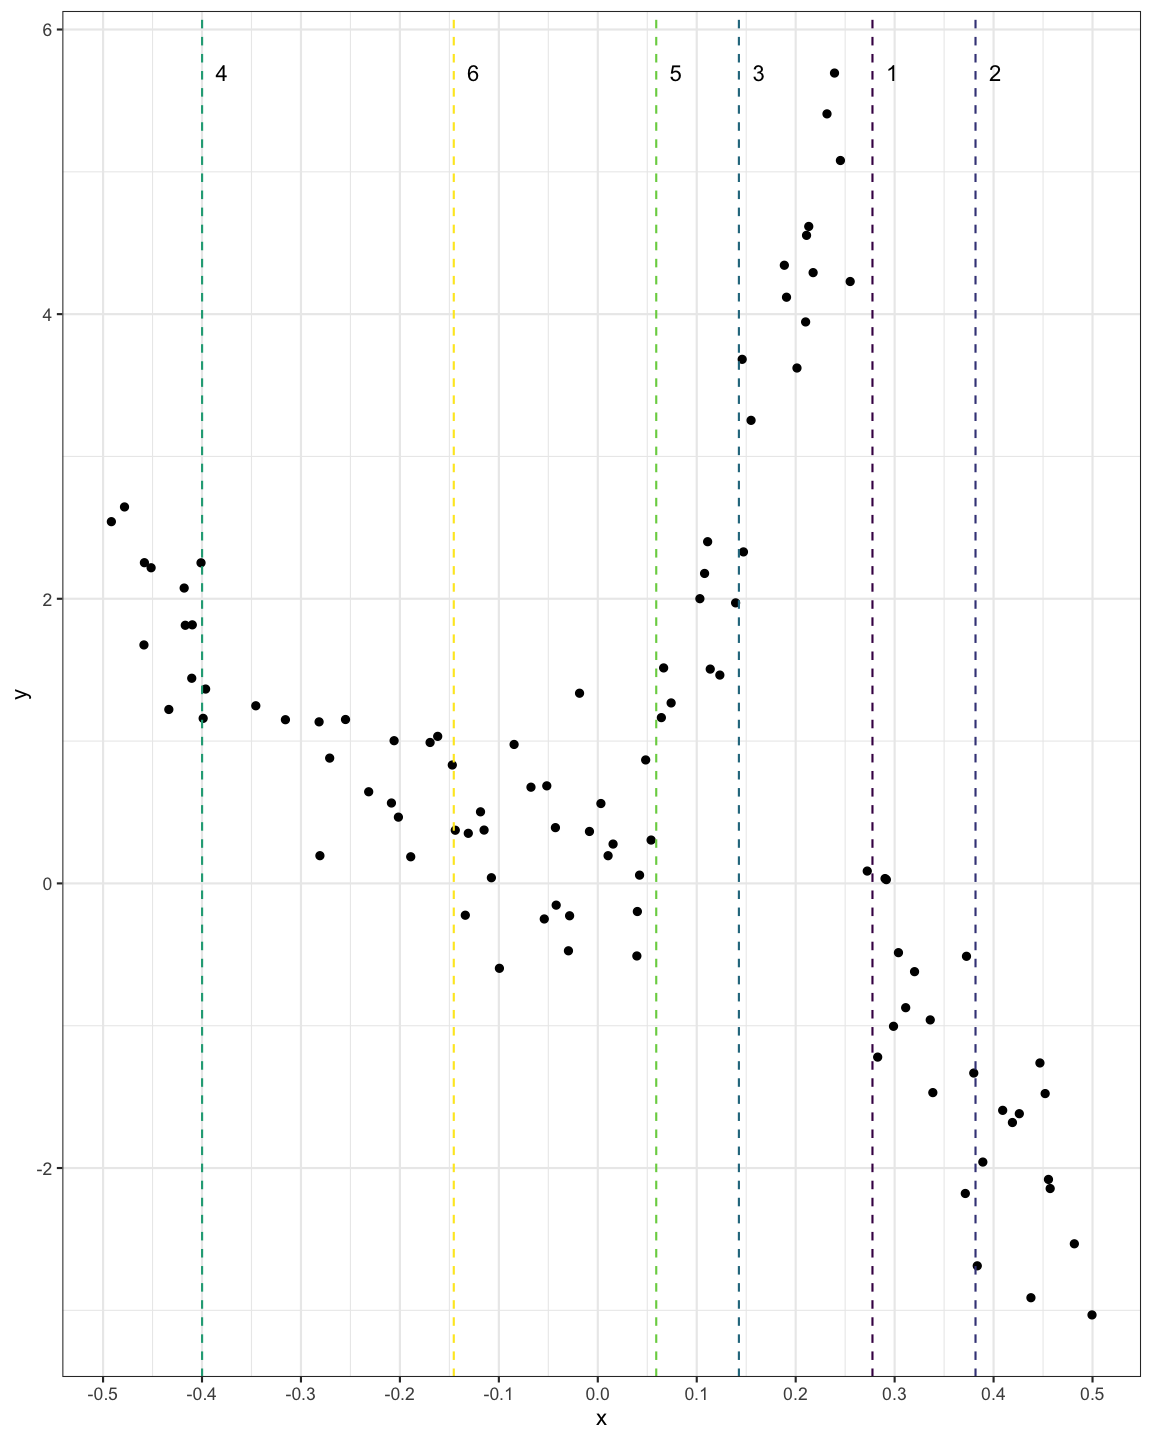
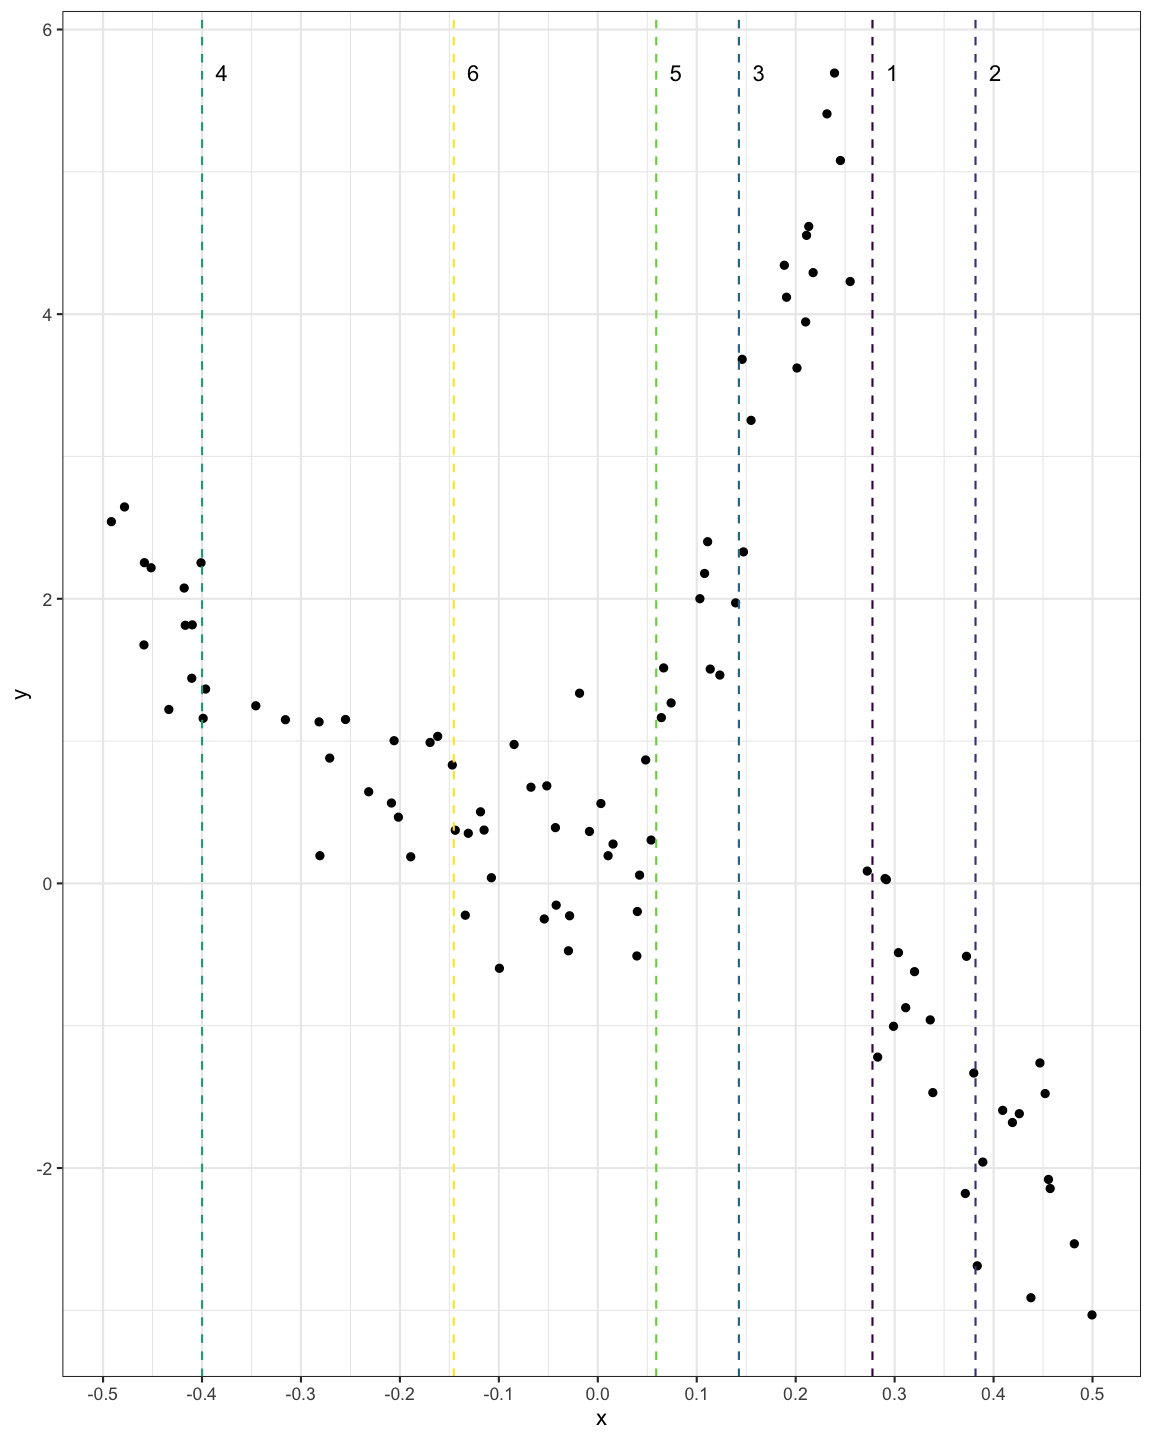
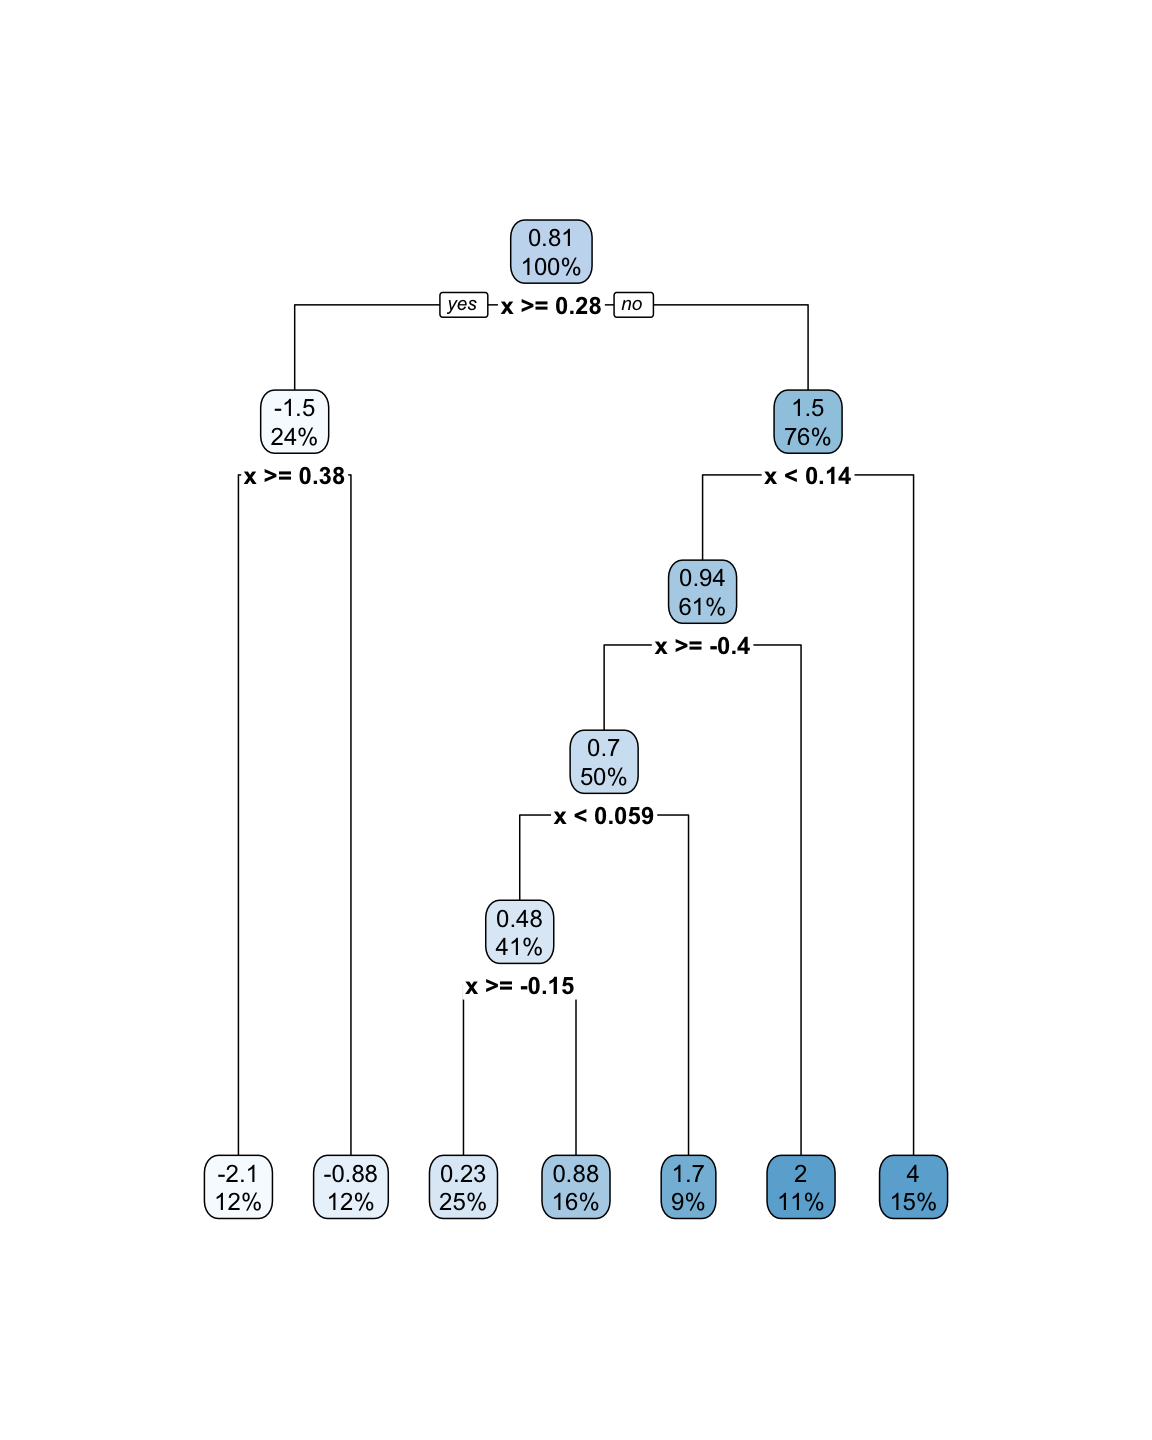

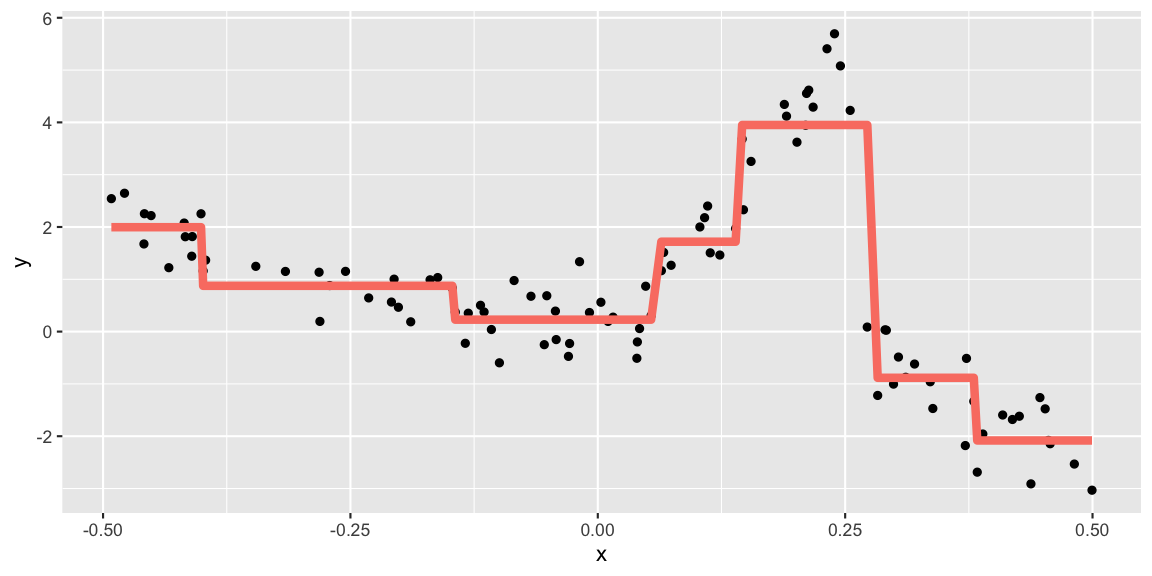
A classification tree predicts each observation belonging to the most commonly occurring class of observations.
However, when we interpret a classification tree, we are often interested not only in the class prediction (what is most common), but also the proportion of correct classifications.
SST=∑(yi−ˉy)2
Since we now have a category, we need some way to describe that.
We need something else!
$$ E = 1 - \text{max}{k}(\hat{p}{mk}) $$
Here, ˆpmk refers to the proportion of observations in the mth region, from the kth class.
Another way to think about this is to understand when E is zero, and when E is large
E=1−maxk(ˆpmk)
E is zero when maxk(ˆpmk) is 1, which is 1 when observations are the same class:
Consider the dataset Exam where two exam scores are given for each student,
and a class Label represents whether they passed or failed the course.
## Exam1 Exam2 Label## 1 34.62366 78.02469 0## 2 30.28671 43.89500 0## 3 35.84741 72.90220 0## 4 60.18260 86.30855 1
Open "10b-exercise-intro.Rmd" and let's decide a point to split the data.
Along all splits for Exam1 classifying according to the majority class for the left and right splits
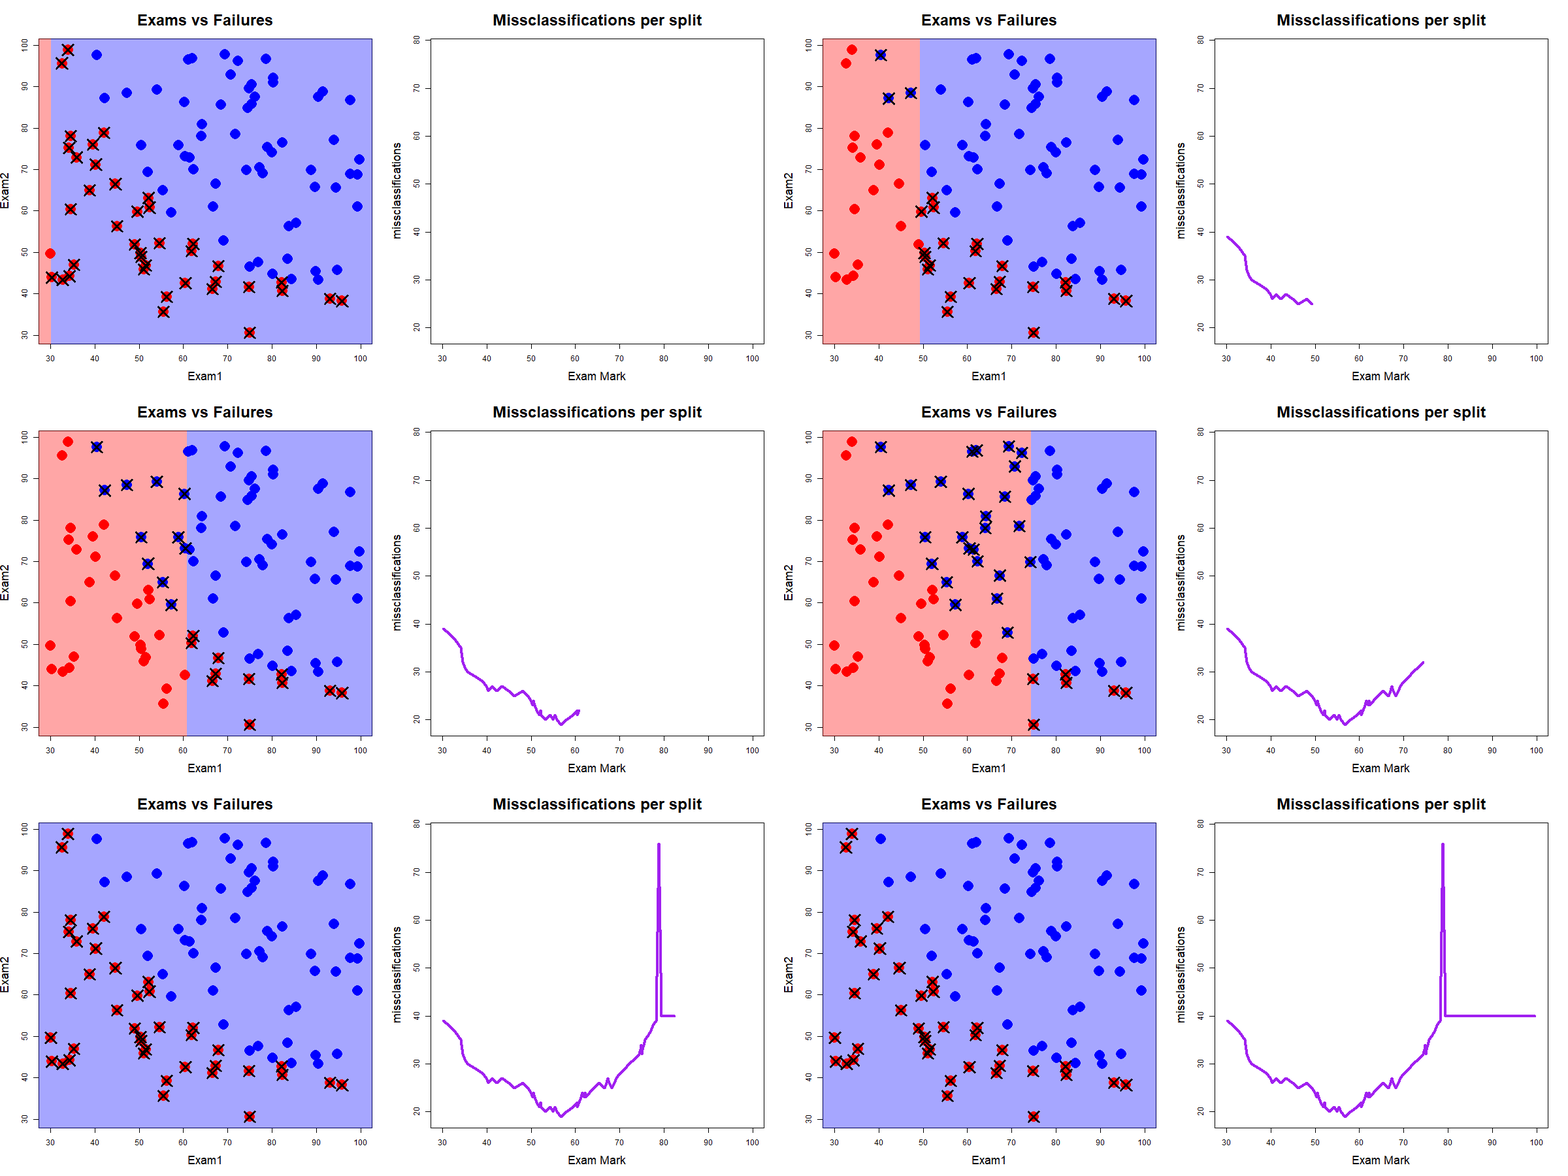
Red dots are "fails", blue dots are "passes", and crosses indicate misclassifications. Source: John Ormerod, U.Syd
Along all splits for Exam2 classifying according to the majority class for the top and bottom splits
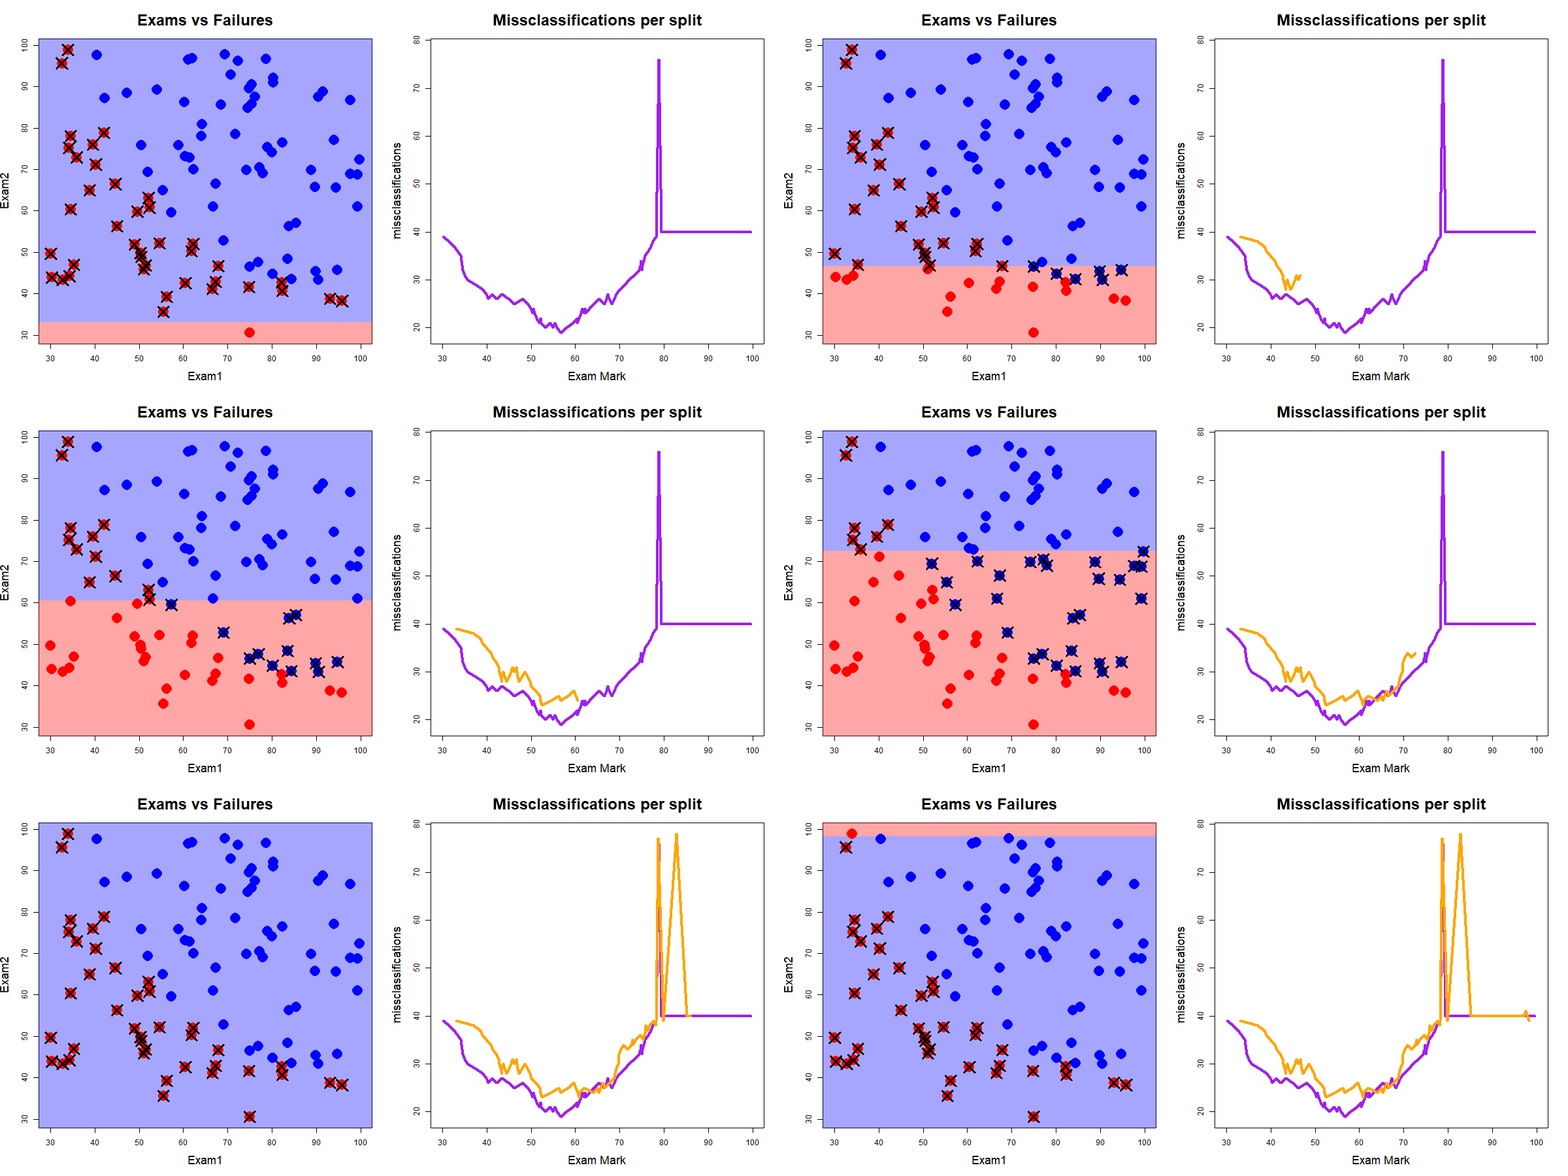
Red dots are "fails", blue dots are "passes", and crosses indicate misclassifications. Source: John Ormerod, U.Syd
Exam1 and Exam2 splitsExam1 was 19 when the value of Exam1 was 56.7Exam2 was 23 when the value of Exam2 was 52.5Exam1 and Exam2 splitsExam1 was 19 when the value of Exam1 was 56.7Exam2 was 23 when the value of Exam2 was 52.5So we split on the best of these, i.e., split the data on Exam1 at 56.7.
It turns out that classification error is not sufficiently sensitive for tree-growing.
In practice two other measures are preferable, as they are more sensitive:
They are both quite similar numerically.
Small values mean that a node contains mostly observations of a single class, referred to as node purity.
Y: presence of heart disease (Yes/No)
X: heart and lung function measurements
## [1] "Age" "Sex" "ChestPain" "RestBP" "Chol" "Fbs" ## [7] "RestECG" "MaxHR" "ExAng" "Oldpeak" "Slope" "Ca" ## [13] "Thal" "AHD"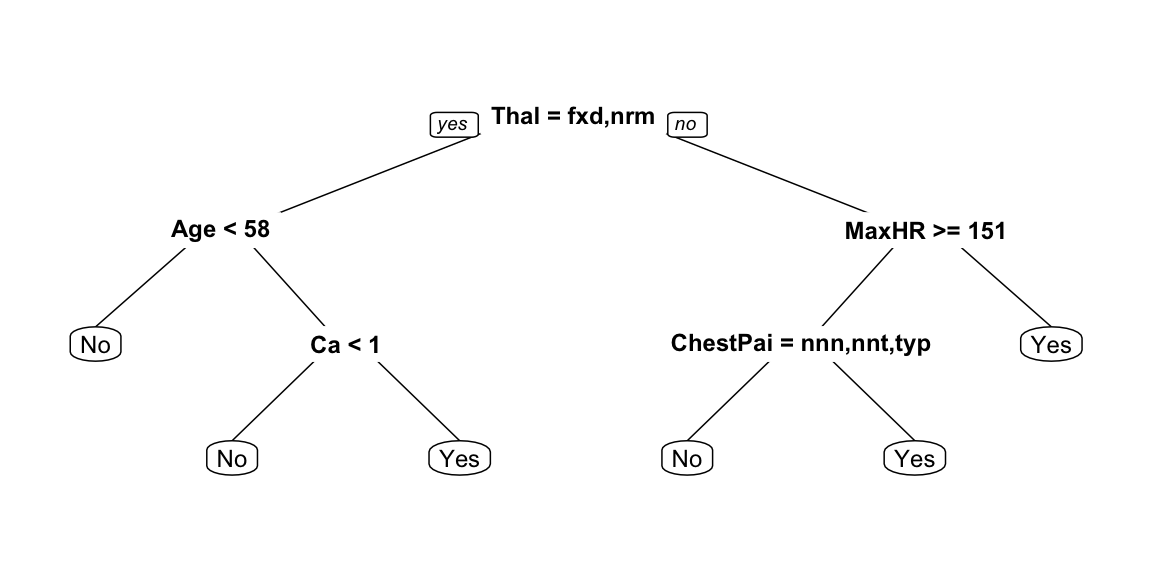
Trees can be built deeper by:
cp, which sets the difference between impurity values required to continue splitting.minsplit and minbucket parameters, which control the number of observations below splits are forbidden.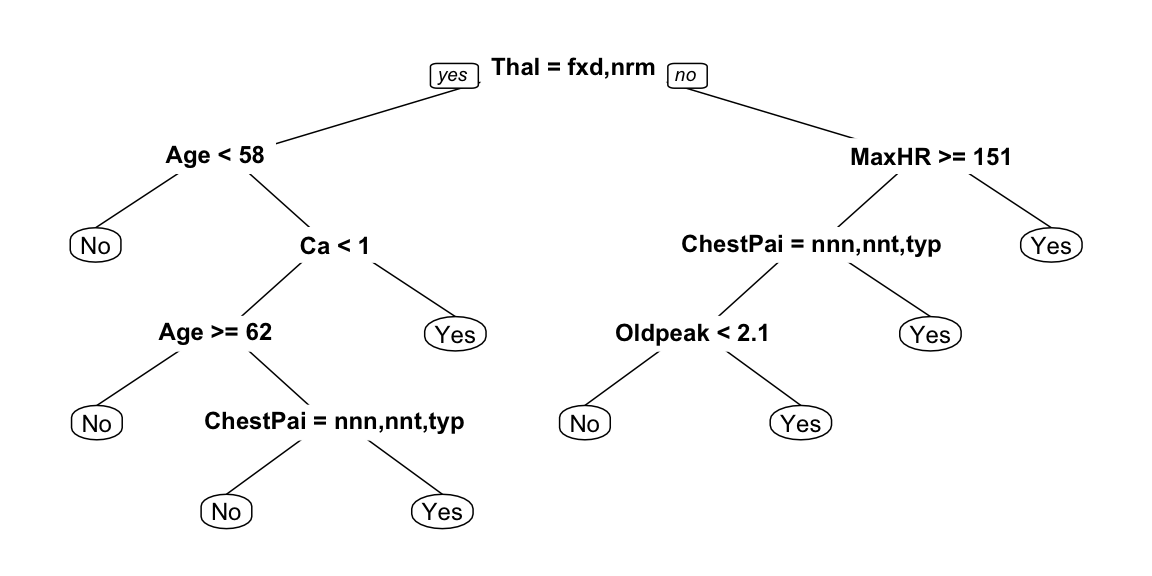
| true | |||
| C1 (positive) | C2 (negative) | ||
| pred- | C1 | a | b |
| icted | C2 | c | d |
## Reference## Prediction No Yes## No 75 5## Yes 11 58## Accuracy ## 0.8926174Physical measurements on WA crabs, males and females.
Data source: Campbell, N. A. & Mahon, R. J. (1974)
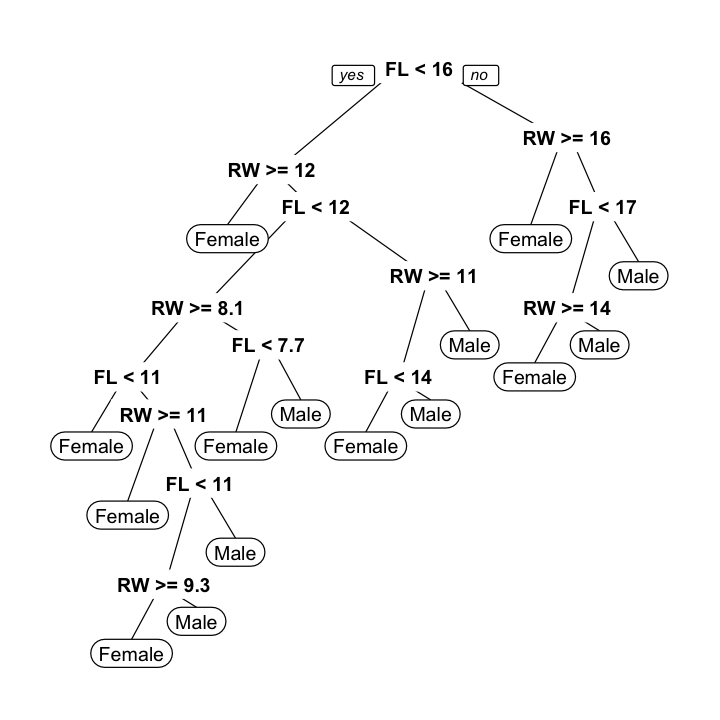
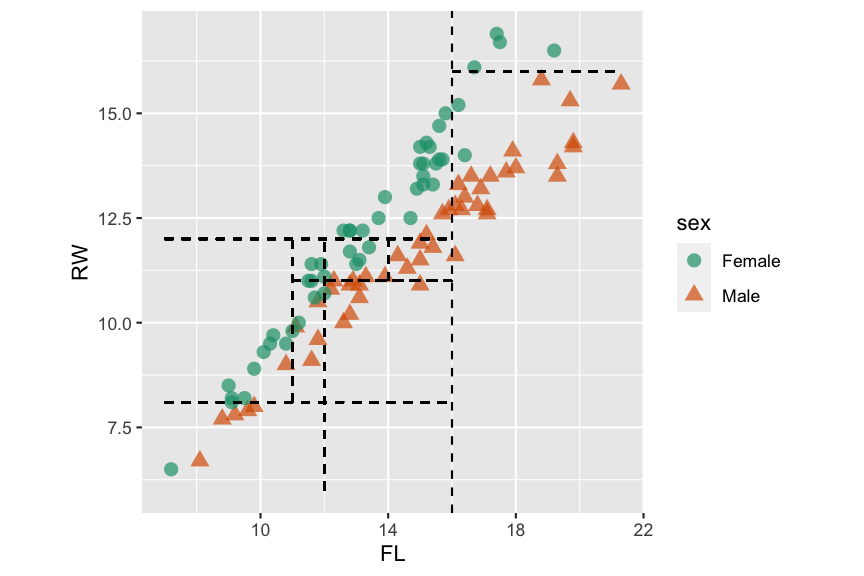
Classification tree

Linear discriminant classifier

Strengths:
Weaknesses:

This work is licensed under a Creative Commons Attribution-ShareAlike 4.0 International License.
Lecturer: Professer Di Cook & Nicholas Tierney & Stuart Lee
Department of Econometrics and Business Statistics
nicholas.tierney@monash.edu
May 2020
Keyboard shortcuts
| ↑, ←, Pg Up, k | Go to previous slide |
| ↓, →, Pg Dn, Space, j | Go to next slide |
| Home | Go to first slide |
| End | Go to last slide |
| Number + Return | Go to specific slide |
| b / m / f | Toggle blackout / mirrored / fullscreen mode |
| c | Clone slideshow |
| p | Toggle presenter mode |
| t | Restart the presentation timer |
| ?, h | Toggle this help |
| Esc | Back to slideshow |