ETC1010: Introduction to Data Analysis
Week 1, part B
Week of introduction
Lecturer: Nicholas Tierney
Department of Econometrics and Business Statistics
ETC1010.Clayton-x@monash.edu
11th Mar 2020
Press the right arrow to progress to the next slide!
Lecturer: Nicholas Tierney
Department of Econometrics and Business Statistics
ETC1010.Clayton-x@monash.edu
11th Mar 2020

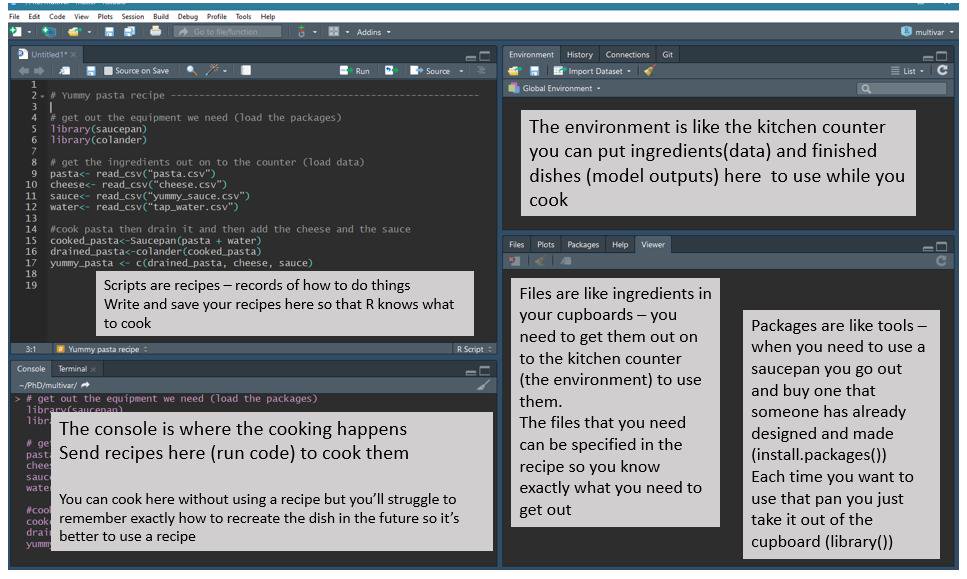
From Jessica Ward (@JKRWard) of R Ladies Newcaslte (UK) - @RLadiesNCL https://twitter.com/RLadiesNCL/status/1138812826917724160
do_this(to_this)do_this(to_this)$:dataframe$var_namedo_this(to_this)$:dataframe$var_nameinstall.packages, and loaded with library , once per session:install.packages("package_name")library(package_name)Only 6 out of 53 landmark results could be reproduced
-- Amgen, 2014*
Only 6 out of 53 landmark results could be reproduced
-- Amgen, 2014*
An estimated 75% - 90% of preclinical results cannot be reproduced
Only 6 out of 53 landmark results could be reproduced
-- Amgen, 2014*
An estimated 75% - 90% of preclinical results cannot be reproduced
Estimated annual cost of irreproducibility for biomedical industry = 28 Billion USD
* Heard via Garret Grolemund's great talk
Near-term goals:
Near-term goals:
Long-term goals:
Literate programming shines some light on this dark area of science.
An idea from Donald Knuth where you combine your text with your code output to create a document.
A blend of your literature (text), and your programming (code), to create something you can read from top to bottom.
Introduction, methods, results, discussion, and conclusion,
Introduction, methods, results, discussion, and conclusion,
All the bits of code that make each section.
Introduction, methods, results, discussion, and conclusion,
All the bits of code that make each section.
With rmarkdown, you can see all the pieces of your data analysis all together.
Introduction, methods, results, discussion, and conclusion,
All the bits of code that make each section.
With rmarkdown, you can see all the pieces of your data analysis all together.
Each time you knit the analysis is ran from the beginning
In 2004, John Gruber, of daring fireball created markdown, a simple way to create text that rendered into a HTML webpage.
- bullet list- bullet list- bullet list- bullet list- bullet list- bullet list1. numbered list2. numbered list3. numbered list__bold__, **bold**, _italic_, *italic*> quote of something profound1. numbered list2. numbered list3. numbered list__bold__, **bold**, _italic_, *italic*> quote of something profoundbold, bold,
italic, italic
quote of something profound
With very little marking up, we can create rich text, that actually resembles the text that we want to see.
With very little marking up, we can create rich text, that actually resembles the text that we want to see.
Learn to use markdown Spend five minutes working through markdowntutorial.com
05:00
With very little marking up, we can create rich text, that actually resembles the text that we want to see.
Learn to use markdown Spend five minutes working through markdowntutorial.com
05:00
Q: How do we take markdown + R code = "literate programming environment"
A: Rmarkdown
Provides an environment where you can write your complete analysis, and marries your text, and code together into a rich document.
Provides an environment where you can write your complete analysis, and marries your text, and code together into a rich document.
You write your code as code chunks, put your text around that, and then hey presto, you have a document you can reproduce.

There are three parts to an rmarkdown document.
There are three parts to an rmarkdown document.
DEMO
The metadata of the document tells you how it is formed - what the title is, what date to put, and other control information.
If you're familiar with LATEX, this is similar to how you specify document type, styles, fonts, options, etc in the front matter / preamble.
---title: "An example document"author: "Nicholas Tierney"output: html_document---It starts an ends with three dashes ---, and has fields like the following: title, author, and output.
Is markdown, as we discussed in the earlier section,
It provides a simple way to mark up text
1. bullet list2. bullet list3. bullet listWe refer to code in an rmarkdown document in two ways:
Code chunks are marked by three backticks and curly braces with r inside them:
```{r chunk-name}# a code chunk```A backtick is a special character you might not have seen before, it is typically located under the tilde key (~). On USA / Australia keyboards, is under the escape key:

image from https://commons.wikimedia.org/wiki/File:ANSI_Keyboard_Layout_Diagram_with_Form_Factor.svg
Sometimes you want to run the code inside a sentence. This is called running the code "inline".
Sometimes you want to run the code inside a sentence. This is called running the code "inline".
You might want to run the code inline to name the number of variables or rows in a dataset in a sentence like:
There are XXX observations in the airquality dataset, and XXX variables.
You can call code "inline" like so:
There are `r nrow(airquality) ` observations in the airquality dataset, and `r ncol(airquality) ` variables.Which gives you the following sentence
You can call code "inline" like so:
There are `r nrow(airquality) ` observations in the airquality dataset, and `r ncol(airquality) ` variables.Which gives you the following sentence
There are 153 observations in the airquality dataset, and 6 variables.
If your data changes upstream
You don't need to work out where you mentioned your data
If your data changes upstream
You don't need to work out where you mentioned your data
You just update the document. 🎉
Go to rstudio.cloud and go to "ida-exercise-1b"
05:00
Make sure you finish the exercise on the rstudio.cloud
Straight after the ```{r you can use a text string to name the chunk:
```{r read-crime-data}crime <- read_csv("data/crime-data.csv")```Naming code chunks has three advantages:
Every chunk should ideally have a name.
Naming things is hard, but follow these rules and you'll be fine:
read-gapminder)You can control how the code is output by changing the code chunk options which follow the title.
```{r read-gapminder, eval = FALSE, echo = TRUE}gap <- read_csv("gapminder.csv")```What do you think this does?
00:30
The code chunk options you need to know about right now are:
cache: TRUE / FALSE. Do you want to save the output of the chunk so it doesn't have to run next time?eval: TRUE / FALSE Do you want to evaluate the code?echo: TRUE / FALSE Do you want to print the code?include: TRUE / FALSE Do you want to include code output in the final output document? Setting to FALSE means nothing is put into the output document, but the code is still run.You can read more about the options at the official documentation: https://yihui.name/knitr/options/#code-evaluation
rstudio.cloud, open document 01-oz-atlas.Rmd and change the document so that the code output is hidden, but the graphics are shown. (Hint: Google "rstudio rmarkdown cheatsheet" for some tips!)05:00
You can set the default chunk behaviour once at the top of the .Rmd file using a chunk like:
knitr::opts_chunk$set( echo = FALSE, cache = TRUE)then you will only need to add chunk options when you have the occasional one that you'd like to behave differently.
01-oz-atlas.Rmd document on rstudio.cloud and change the global settings at the top of the rmarkdown document to echo = FALSE, and cache = TRUEknitr::opts_chunk$set( echo = FALSE, cache = TRUE)05:00
The many different outputs of rmarkdown
File > New R Markdown > PresentationFile > New R Markdown > From template list.oz-atlas-final.RmdLecturer: Nicholas Tierney
Department of Econometrics and Business Statistics
ETC1010.Clayton-x@monash.edu
11th Mar 2020
This work is licensed under a Creative Commons Attribution-NonCommercial-ShareAlike 4.0 International License.
Should be able to answer the questions:
How should I start an rmarkdown document? What do I put in the YAML metadata? How do I create a code chunk? What sort of options to I need to worry about for my code? What is the value in a reproducible report? What is markdown? Can I combine my software and my writing?
Lecturer: Nicholas Tierney
Department of Econometrics and Business Statistics
ETC1010.Clayton-x@monash.edu
11th Mar 2020
Keyboard shortcuts
| ↑, ←, Pg Up, k | Go to previous slide |
| ↓, →, Pg Dn, Space, j | Go to next slide |
| Home | Go to first slide |
| End | Go to last slide |
| Number + Return | Go to specific slide |
| b / m / f | Toggle blackout / mirrored / fullscreen mode |
| c | Clone slideshow |
| p | Toggle presenter mode |
| t | Restart the presentation timer |
| ?, h | Toggle this help |
| Esc | Back to slideshow |