ETC1010: Introduction to Data Analysis
Week 2, part A
Week of Tidy Data
Lecturer: Nicholas Tierney
Department of Econometrics and Business Statistics
ETC1010.Clayton-x@monash.edu
16th Mar 2020
Press the right arrow to progress to the next slide!
Lecturer: Nicholas Tierney
Department of Econometrics and Business Statistics
ETC1010.Clayton-x@monash.edu
16th Mar 2020
(Discuss with your neighbour)
respiratory failure later for vulnerable people
Up to two weeks can pass between exposure and symptoms
From Tim Church's blog
https://www.instagram.com/p/B9FFVnigLEE/?utm_source=ig_embed
Singapore's videos on COVID19
Vietnam's awesome pop track
naniar, visdat, #rstats 🎤: Credibly Curious w Saskia Freytag
quickdraw

We are going to set up the groups for doing assignment work.
LASTLY, come up with a name for your team (we have provided a suggested name, but you are free to change it!) and tell this to a tutor, along with the names of members of the team.
05:00

That is OK!
The theory of this class will only get you so far
That is OK!
The theory of this class will only get you so far
The real learning happens from doing the data analysis - the pressure of a deadline can also help.
I want to take a moment to run through RStudio, what it is, and how it works again. (demo)

You're ready to sit down with a newly-obtained dataset, excited about how it will open a world of insight and understanding, and then find you can't use it. You'll first have to spend a significant amount of time to restructure the data to even begin to produce a set of basic descriptive statistics or link it to other data you've been using.
--John Spencer (Measure Evaluation)

"Tidy data" is a term meant to provide a framework for producing data that conform to standards that make data easier to use. Tidy data may still require some cleaning for analysis, but the job will be much easier.
--John Spencer (Measure Evaluation)
library(tidyverse)grad <- read_csv(here::here("slides/data/graduate-programs.csv"))grad## # A tibble: 412 x 16## subject Inst AvNumPubs AvNumCits PctFacGrants PctCompletion MedianTimetoDeg…## <chr> <chr> <dbl> <dbl> <dbl> <dbl> <dbl>## 1 econom… ARIZ… 0.9 1.57 31.3 31.7 5.6 ## 2 econom… AUBU… 0.79 0.64 77.6 44.4 3.84## 3 econom… BOST… 0.51 1.03 43.5 46.8 5 ## 4 econom… BOST… 0.49 2.66 36.9 34.2 5.5 ## 5 econom… BRAN… 0.3 3.03 36.8 48.7 5.29## 6 econom… BROW… 0.84 2.31 27.1 54.6 6 ## 7 econom… CALI… 0.99 2.31 56.4 83.3 4 ## 8 econom… CARN… 0.43 1.67 35.2 45.6 5.05## 9 econom… CITY… 0.35 1.06 38.1 27.9 5.2 ## 10 econom… CLAR… 0.47 0.7 24.7 37.7 5.17## # … with 402 more rows, and 9 more variables: PctMinorityFac <dbl>,## # PctFemaleFac <dbl>, PctFemaleStud <dbl>, PctIntlStud <dbl>, AvNumPhDs <dbl>,## # AvGREs <dbl>, TotFac <dbl>, PctAsstProf <dbl>, NumStud <dbl>Good things about the format:
## # A tibble: 6 x 16## subject Inst AvNumPubs AvNumCits PctFacGrants PctCompletion MedianTimetoDeg…## <chr> <chr> <dbl> <dbl> <dbl> <dbl> <dbl>## 1 econom… ARIZ… 0.9 1.57 31.3 31.7 5.6 ## 2 econom… AUBU… 0.79 0.64 77.6 44.4 3.84## 3 econom… BOST… 0.51 1.03 43.5 46.8 5 ## 4 econom… BOST… 0.49 2.66 36.9 34.2 5.5 ## 5 econom… BRAN… 0.3 3.03 36.8 48.7 5.29## 6 econom… BROW… 0.84 2.31 27.1 54.6 6 ## # … with 9 more variables: PctMinorityFac <dbl>, PctFemaleFac <dbl>,## # PctFemaleStud <dbl>, PctIntlStud <dbl>, AvNumPhDs <dbl>, AvGREs <dbl>,## # TotFac <dbl>, PctAsstProf <dbl>, NumStud <dbl>Good things about the format:
## # A tibble: 6 x 16## subject Inst AvNumPubs AvNumCits PctFacGrants PctCompletion MedianTimetoDeg…## <chr> <chr> <dbl> <dbl> <dbl> <dbl> <dbl>## 1 econom… ARIZ… 0.9 1.57 31.3 31.7 5.6 ## 2 econom… AUBU… 0.79 0.64 77.6 44.4 3.84## 3 econom… BOST… 0.51 1.03 43.5 46.8 5 ## 4 econom… BOST… 0.49 2.66 36.9 34.2 5.5 ## 5 econom… BRAN… 0.3 3.03 36.8 48.7 5.29## 6 econom… BROW… 0.84 2.31 27.1 54.6 6 ## # … with 9 more variables: PctMinorityFac <dbl>, PctFemaleFac <dbl>,## # PctFemaleStud <dbl>, PctIntlStud <dbl>, AvNumPhDs <dbl>, AvGREs <dbl>,## # TotFac <dbl>, PctAsstProf <dbl>, NumStud <dbl>Good things about the format:
## # A tibble: 6 x 16## subject Inst AvNumPubs AvNumCits PctFacGrants PctCompletion MedianTimetoDeg…## <chr> <chr> <dbl> <dbl> <dbl> <dbl> <dbl>## 1 econom… ARIZ… 0.9 1.57 31.3 31.7 5.6 ## 2 econom… AUBU… 0.79 0.64 77.6 44.4 3.84## 3 econom… BOST… 0.51 1.03 43.5 46.8 5 ## 4 econom… BOST… 0.49 2.66 36.9 34.2 5.5 ## 5 econom… BRAN… 0.3 3.03 36.8 48.7 5.29## 6 econom… BROW… 0.84 2.31 27.1 54.6 6 ## # … with 9 more variables: PctMinorityFac <dbl>, PctFemaleFac <dbl>,## # PctFemaleStud <dbl>, PctIntlStud <dbl>, AvNumPhDs <dbl>, AvGREs <dbl>,## # TotFac <dbl>, PctAsstProf <dbl>, NumStud <dbl>Rows contain information about the institution
Columns contain types of information, like average number of publications, average number of citations, % completion,
Easy to make summaries:
grad %>% count(subject)## # A tibble: 4 x 2## subject n## <chr> <int>## 1 astronomy 32## 2 economics 117## 3 entomology 27## 4 psychology 236Easy to make summaries:
grad %>% filter(subject == "economics") %>% summarise(mean = mean(NumStud), s = sd(NumStud))## # A tibble: 1 x 2## mean s## <dbl> <dbl>## 1 60.7 39.4Easy to make a plot
grad %>% filter(subject == "economics") %>% ggplot(aes(x = NumStud, y = MedianTimetoDegree)) + geom_point() + theme(aspect.ratio = 1)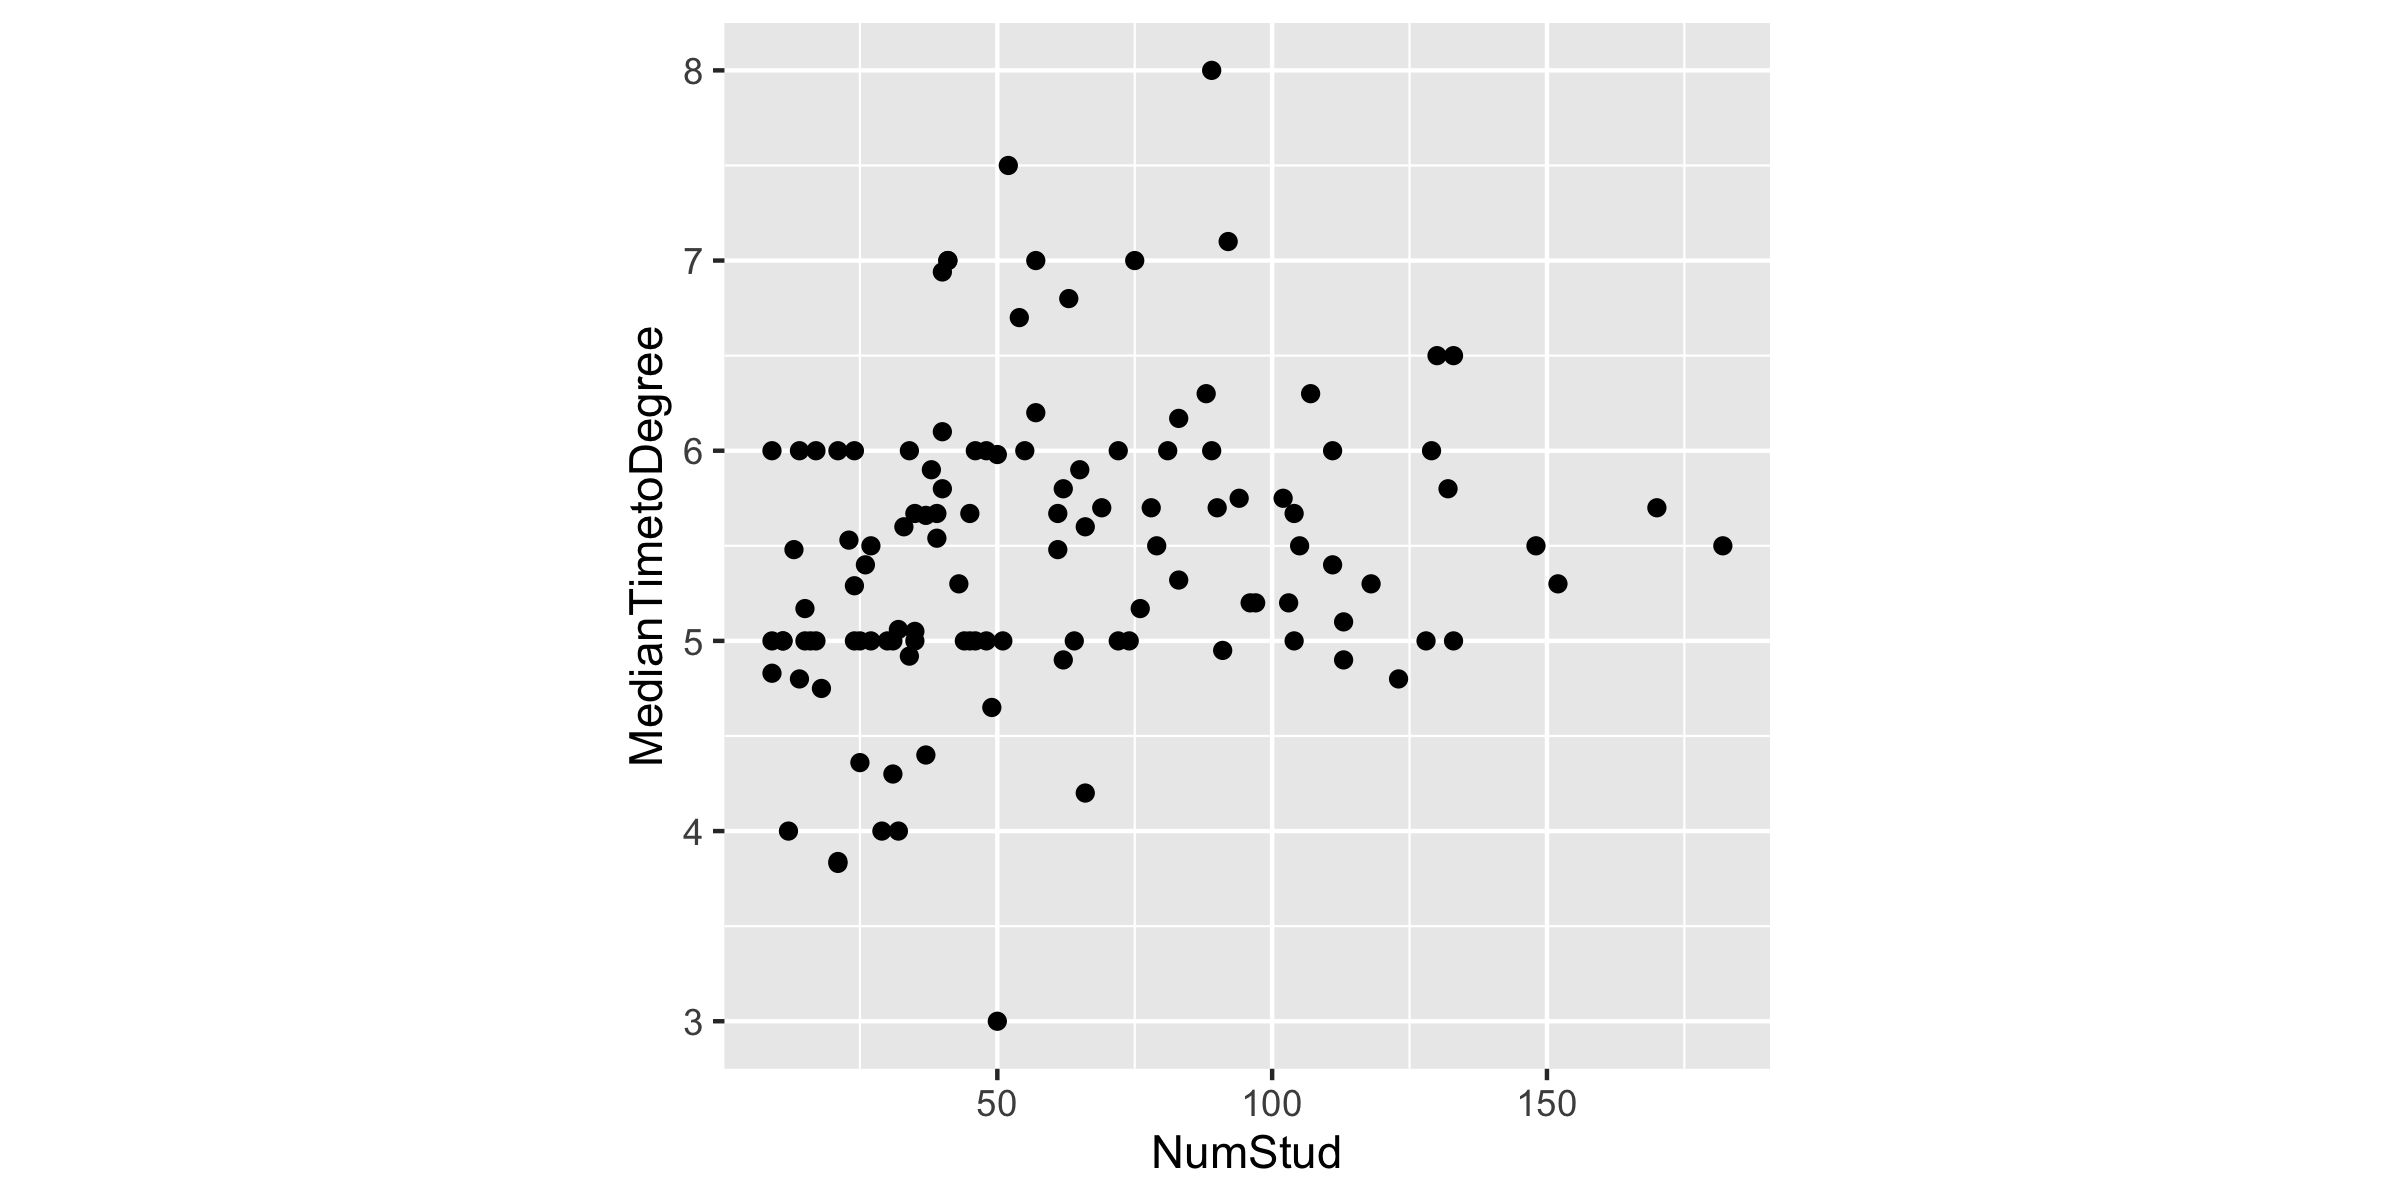
data/ directory with many datasets! graduate-programs.Rmd03:00
"What is the best description of the relationship between number of students and median time to degree?"
What could this image say about R?
03:00

## # A tibble: 6 x 16## subject Inst AvNumPubs AvNumCits PctFacGrants PctCompletion MedianTimetoDeg…## <chr> <chr> <dbl> <dbl> <dbl> <dbl> <dbl>## 1 econom… ARIZ… 0.9 1.57 31.3 31.7 5.6 ## 2 econom… AUBU… 0.79 0.64 77.6 44.4 3.84## 3 econom… BOST… 0.51 1.03 43.5 46.8 5 ## 4 econom… BOST… 0.49 2.66 36.9 34.2 5.5 ## 5 econom… BRAN… 0.3 3.03 36.8 48.7 5.29## 6 econom… BROW… 0.84 2.31 27.1 54.6 6 ## # … with 9 more variables: PctMinorityFac <dbl>, PctFemaleFac <dbl>,## # PctFemaleStud <dbl>, PctIntlStud <dbl>, AvNumPhDs <dbl>, AvGREs <dbl>,## # TotFac <dbl>, PctAsstProf <dbl>, NumStud <dbl>## # A tibble: 6 x 16## subject Inst AvNumPubs AvNumCits PctFacGrants PctCompletion MedianTimetoDeg…## <chr> <chr> <dbl> <dbl> <dbl> <dbl> <dbl>## 1 econom… ARIZ… 0.9 1.57 31.3 31.7 5.6 ## 2 econom… AUBU… 0.79 0.64 77.6 44.4 3.84## 3 econom… BOST… 0.51 1.03 43.5 46.8 5 ## 4 econom… BOST… 0.49 2.66 36.9 34.2 5.5 ## 5 econom… BRAN… 0.3 3.03 36.8 48.7 5.29## 6 econom… BROW… 0.84 2.31 27.1 54.6 6 ## # … with 9 more variables: PctMinorityFac <dbl>, PctFemaleFac <dbl>,## # PctFemaleStud <dbl>, PctIntlStud <dbl>, AvNumPhDs <dbl>, AvGREs <dbl>,## # TotFac <dbl>, PctAsstProf <dbl>, NumStud <dbl>## # A tibble: 6 x 16## subject Inst AvNumPubs AvNumCits PctFacGrants PctCompletion MedianTimetoDeg…## <chr> <chr> <dbl> <dbl> <dbl> <dbl> <dbl>## 1 econom… ARIZ… 0.9 1.57 31.3 31.7 5.6 ## 2 econom… AUBU… 0.79 0.64 77.6 44.4 3.84## 3 econom… BOST… 0.51 1.03 43.5 46.8 5 ## 4 econom… BOST… 0.49 2.66 36.9 34.2 5.5 ## 5 econom… BRAN… 0.3 3.03 36.8 48.7 5.29## 6 econom… BROW… 0.84 2.31 27.1 54.6 6 ## # … with 9 more variables: PctMinorityFac <dbl>, PctFemaleFac <dbl>,## # PctFemaleStud <dbl>, PctIntlStud <dbl>, AvNumPhDs <dbl>, AvGREs <dbl>,## # TotFac <dbl>, PctAsstProf <dbl>, NumStud <dbl>Tabular data is a set of values, each associated with a variable and an observation. Tabular data is tidy iff (if and only if):
cell.
For each of these data examples, let's try together to identify the variables and the observations - some are HARD!
Is in tidy tabular form.
## # A tibble: 412 x 16## subject Inst AvNumPubs AvNumCits PctFacGrants PctCompletion MedianTimetoDeg…## <chr> <chr> <dbl> <dbl> <dbl> <dbl> <dbl>## 1 econom… ARIZ… 0.9 1.57 31.3 31.7 5.6 ## 2 econom… AUBU… 0.79 0.64 77.6 44.4 3.84## 3 econom… BOST… 0.51 1.03 43.5 46.8 5 ## 4 econom… BOST… 0.49 2.66 36.9 34.2 5.5 ## 5 econom… BRAN… 0.3 3.03 36.8 48.7 5.29## 6 econom… BROW… 0.84 2.31 27.1 54.6 6 ## 7 econom… CALI… 0.99 2.31 56.4 83.3 4 ## 8 econom… CARN… 0.43 1.67 35.2 45.6 5.05## 9 econom… CITY… 0.35 1.06 38.1 27.9 5.2 ## 10 econom… CLAR… 0.47 0.7 24.7 37.7 5.17## # … with 402 more rows, and 9 more variables: PctMinorityFac <dbl>,## # PctFemaleFac <dbl>, PctFemaleStud <dbl>, PctIntlStud <dbl>, AvNumPhDs <dbl>,## # AvGREs <dbl>, TotFac <dbl>, PctAsstProf <dbl>, NumStud <dbl>## # A tibble: 3 x 12## id `WI-6.R1` `WI-6.R2` `WI-6.R4` `WM-6.R1` `WM-6.R2` `WI-12.R1` `WI-12.R2`## <chr> <dbl> <dbl> <dbl> <dbl> <dbl> <dbl> <dbl>## 1 Gene… 2.18 2.20 4.20 2.63 5.06 4.54 5.53## 2 Gene… 1.46 0.585 1.86 0.515 2.88 1.36 2.96## 3 Gene… 2.03 0.870 3.28 0.533 4.63 2.18 5.56## # … with 4 more variables: `WI-12.R4` <dbl>, `WM-12.R1` <dbl>, `WM-12.R2` <dbl>,## # `WM-12.R4` <dbl>02:00
## # A tibble: 1,593 x 12## X1 X2 X3 X4 X5 X9 X13 X17 X21 X25 X29 X33## <chr> <dbl> <chr> <chr> <dbl> <dbl> <dbl> <dbl> <dbl> <dbl> <dbl> <dbl>## 1 ASN00086282 1970 07 TMAX 141 124 113 123 148 149 139 153## 2 ASN00086282 1970 07 TMIN 80 63 36 57 69 47 84 78## 3 ASN00086282 1970 07 PRCP 3 30 0 0 36 3 0 0## 4 ASN00086282 1970 08 TMAX 145 128 150 122 109 112 116 142## 5 ASN00086282 1970 08 TMIN 50 61 75 67 41 51 48 -7## 6 ASN00086282 1970 08 PRCP 0 66 0 53 13 3 8 0## 7 ASN00086282 1970 09 TMAX 168 168 162 162 162 150 184 179## 8 ASN00086282 1970 09 TMIN 19 29 62 81 81 55 73 97## 9 ASN00086282 1970 09 PRCP 0 0 0 0 3 5 0 38## 10 ASN00086282 1970 10 TMAX 189 194 204 267 256 228 237 144## # … with 1,583 more rows02:00
## # A tibble: 3,202 x 22## country year new_sp_m04 new_sp_m514 new_sp_m014 new_sp_m1524 new_sp_m2534## <chr> <dbl> <dbl> <dbl> <dbl> <dbl> <dbl>## 1 Afghan… 1997 NA NA 0 10 6## 2 Afghan… 1998 NA NA 30 129 128## 3 Afghan… 1999 NA NA 8 55 55## 4 Afghan… 2000 NA NA 52 228 183## 5 Afghan… 2001 NA NA 129 379 349## 6 Afghan… 2002 NA NA 90 476 481## 7 Afghan… 2003 NA NA 127 511 436## 8 Afghan… 2004 NA NA 139 537 568## 9 Afghan… 2005 NA NA 151 606 560## 10 Afghan… 2006 NA NA 193 837 791## # … with 3,192 more rows, and 15 more variables: new_sp_m3544 <dbl>,## # new_sp_m4554 <dbl>, new_sp_m5564 <dbl>, new_sp_m65 <dbl>, new_sp_mu <dbl>,## # new_sp_f04 <dbl>, new_sp_f514 <dbl>, new_sp_f014 <dbl>, new_sp_f1524 <dbl>,## # new_sp_f2534 <dbl>, new_sp_f3544 <dbl>, new_sp_f4554 <dbl>, new_sp_f5564 <dbl>,## # new_sp_f65 <dbl>, new_sp_fu <dbl>02:00
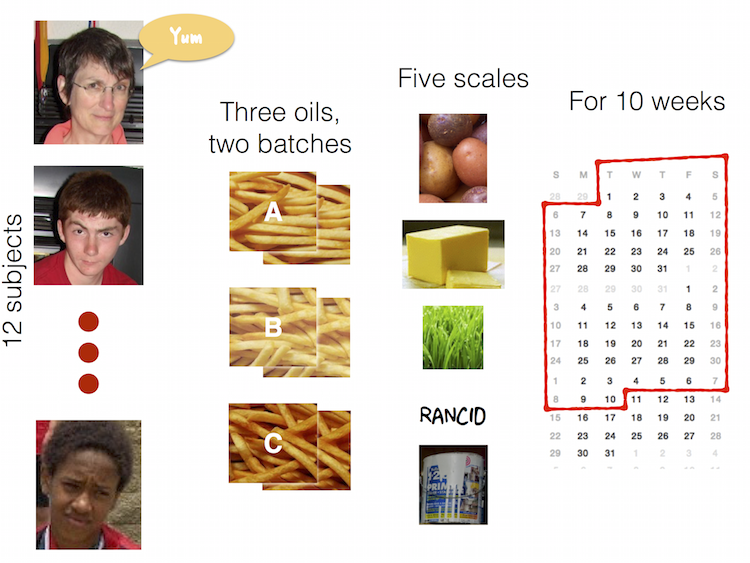
## # A tibble: 696 x 9## time treatment subject rep potato buttery grassy rancid painty## <dbl> <dbl> <dbl> <dbl> <dbl> <dbl> <dbl> <dbl> <dbl>## 1 1 1 3 1 2.9 0 0 0 5.5## 2 1 1 3 2 14 0 0 1.1 0 ## 3 1 1 10 1 11 6.4 0 0 0 ## 4 1 1 10 2 9.9 5.9 2.9 2.2 0 ## 5 1 1 15 1 1.2 0.1 0 1.1 5.1## 6 1 1 15 2 8.8 3 3.6 1.5 2.3## 7 1 1 16 1 9 2.6 0.4 0.1 0.2## 8 1 1 16 2 8.2 4.4 0.3 1.4 4 ## 9 1 1 19 1 7 3.2 0 4.9 3.2## 10 1 1 19 2 13 0 3.1 4.3 10.3## # … with 686 more rowsdata is collated from this story: 41% Of Fliers Think You're Rude If You Recline Your Seat
What are the variables?
## # A tibble: 3 x 6## V1 `V2:Always` `V2:Usually` `V2:About half the… `V2:Once in a wh… `V2:Never`## <chr> <dbl> <dbl> <dbl> <dbl> <dbl>## 1 No, not r… 124 145 82 116 35## 2 Yes, some… 9 27 35 129 81## 3 Yes, very… 3 3 NA 11 54Messy data is messy in its own way. You can make unique solutions, but then another data set comes along, and you have to again make a unique solution.
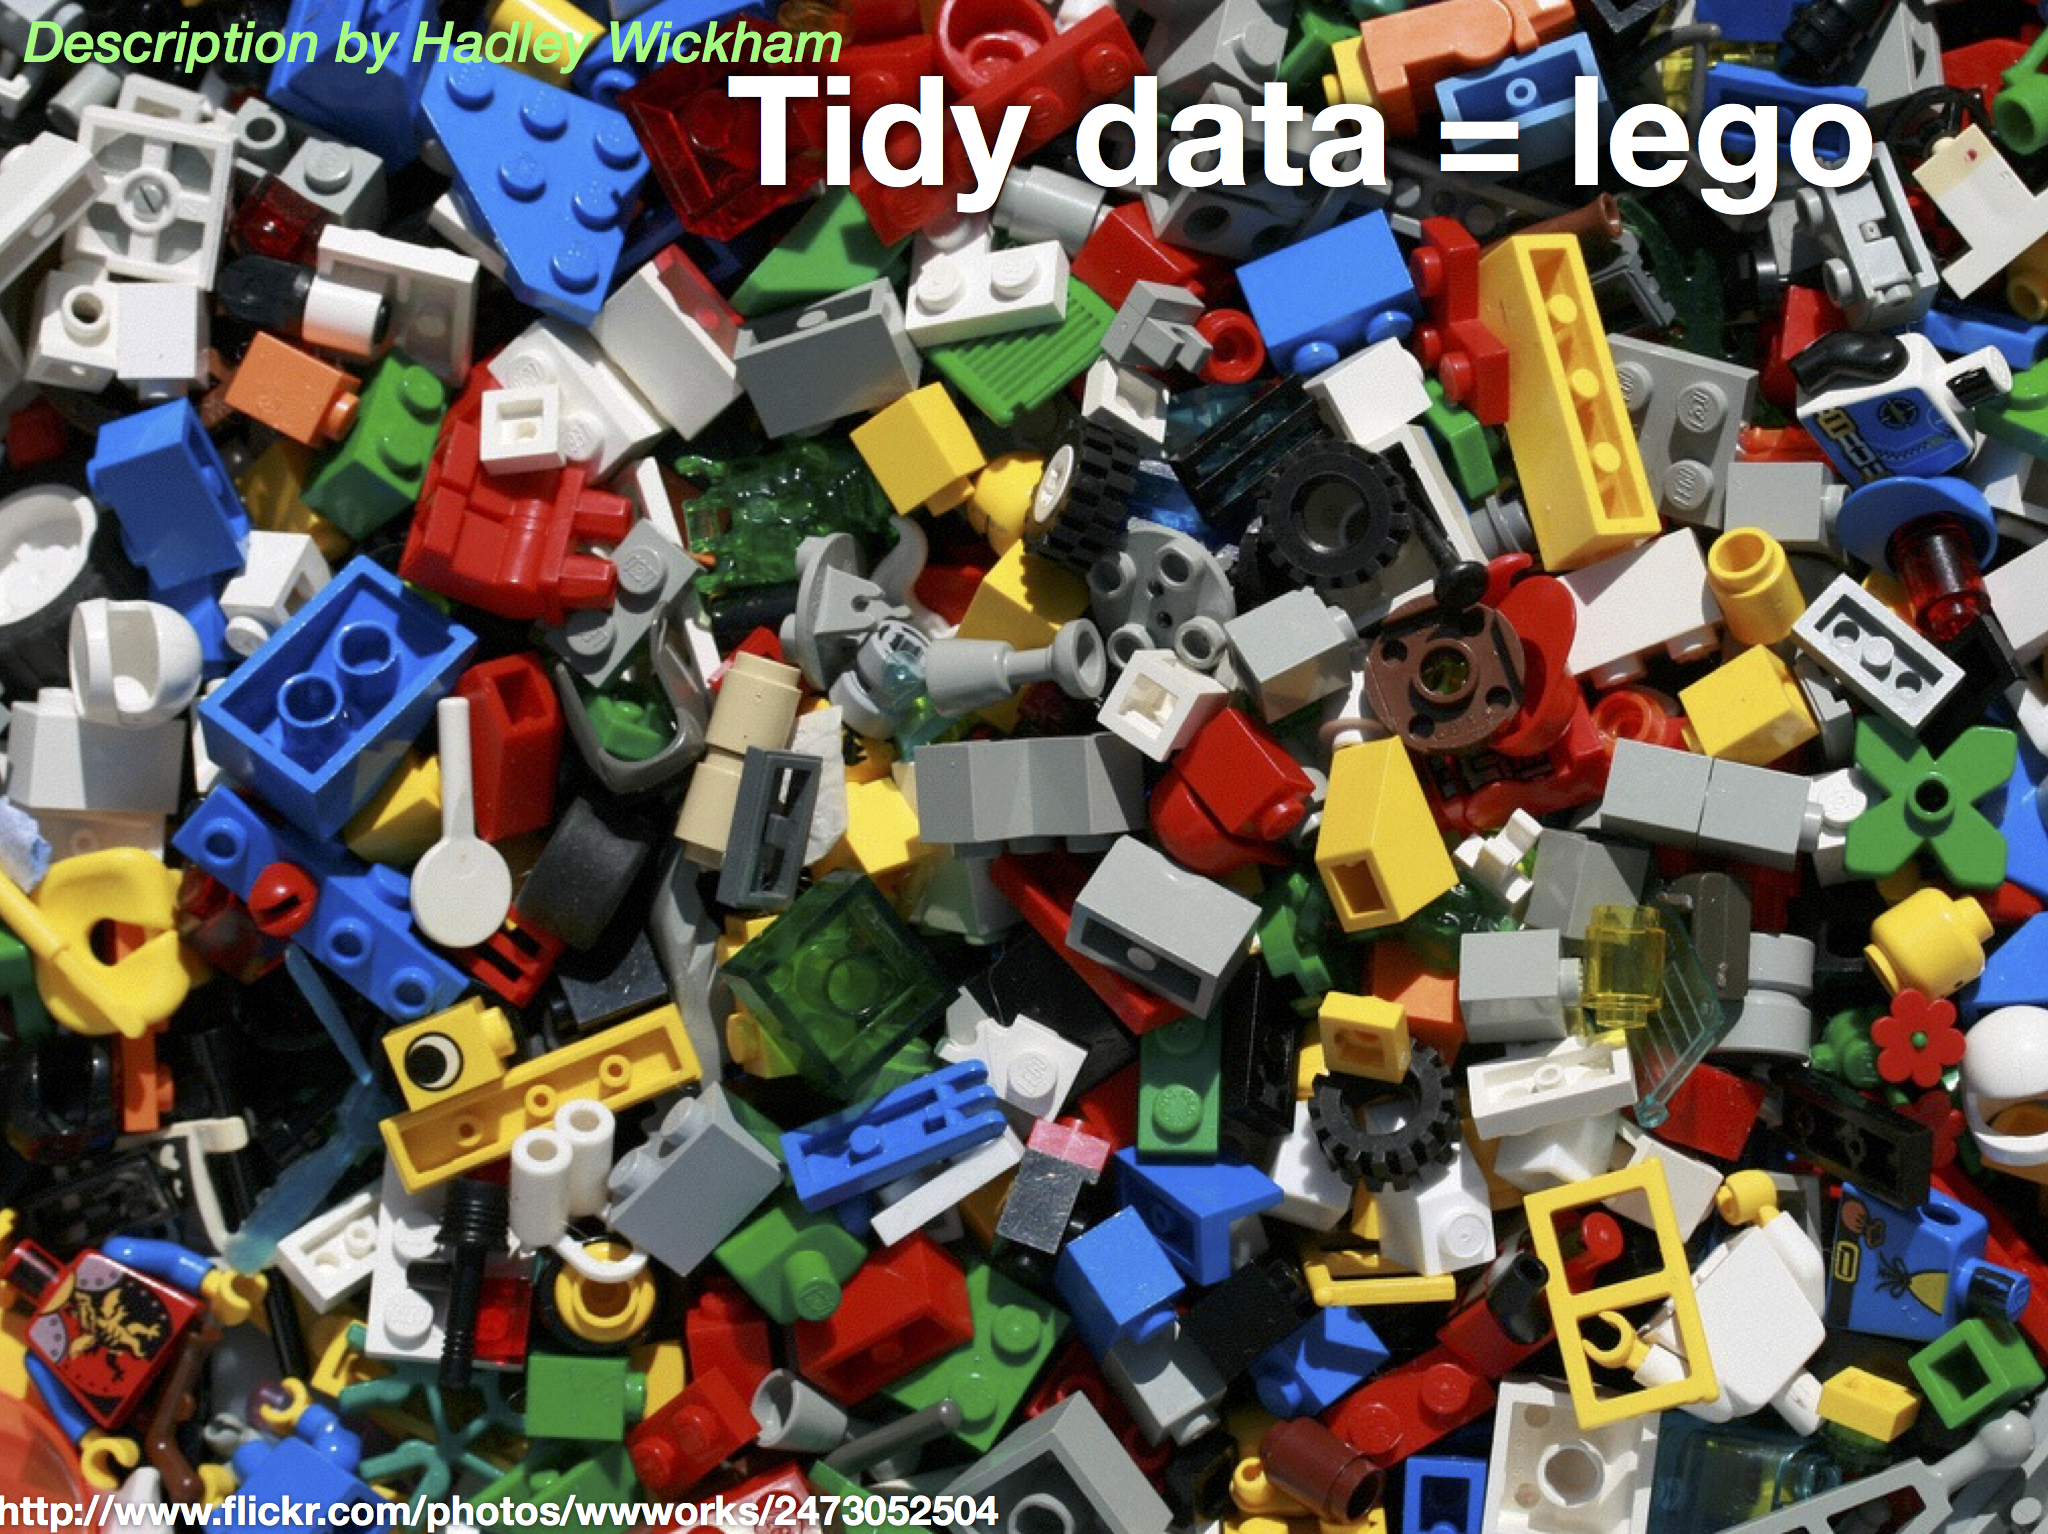
Tidy data can be though of as legos. Once you have this form, you can put it together in so many different ways, to make different analyses.
pivot_longer: Specify the names_to (identifiers) and the values_to (measures) to make longer form data.pivot_wider: Variables split out in columnsseparate: Split one column into manypivot_longerpivot_longer(<DATA>, <COLS>, <NAMES_TO> <VALUES_TO>)pivot_longer: exampletable4a## # A tibble: 3 x 3## country `1999` `2000`## * <chr> <int> <int>## 1 Afghanistan 745 2666## 2 Brazil 37737 80488## 3 China 212258 213766table4a %>% pivot_longer(cols = c("1999", "2000"), names_to = "year", values_to = "cases")## # A tibble: 6 x 3## country year cases## <chr> <chr> <int>## 1 Afghanistan 1999 745## 2 Afghanistan 2000 2666## 3 Brazil 1999 37737## 4 Brazil 2000 80488## 5 China 1999 212258## 6 China 2000 213766Tell me what to put in the following?
## # A tibble: 3 x 12## id `WI-6.R1` `WI-6.R2` `WI-6.R4` `WM-6.R1` `WM-6.R2` `WI-12.R1` `WI-12.R2`## <chr> <dbl> <dbl> <dbl> <dbl> <dbl> <dbl> <dbl>## 1 Gene… 2.18 2.20 4.20 2.63 5.06 4.54 5.53## 2 Gene… 1.46 0.585 1.86 0.515 2.88 1.36 2.96## 3 Gene… 2.03 0.870 3.28 0.533 4.63 2.18 5.56## # … with 4 more variables: `WI-12.R4` <dbl>, `WM-12.R1` <dbl>, `WM-12.R2` <dbl>,## # `WM-12.R4` <dbl>genes## # A tibble: 3 x 12## id `WI-6.R1` `WI-6.R2` `WI-6.R4` `WM-6.R1` `WM-6.R2` `WI-12.R1` `WI-12.R2`## <chr> <dbl> <dbl> <dbl> <dbl> <dbl> <dbl> <dbl>## 1 Gene… 2.18 2.20 4.20 2.63 5.06 4.54 5.53## 2 Gene… 1.46 0.585 1.86 0.515 2.88 1.36 2.96## 3 Gene… 2.03 0.870 3.28 0.533 4.63 2.18 5.56## # … with 4 more variables: `WI-12.R4` <dbl>, `WM-12.R1` <dbl>, `WM-12.R2` <dbl>,## # `WM-12.R4` <dbl>genes_long <- genes %>% pivot_longer(cols = -id, names_to = "variable", values_to = "expr")genes_long## # A tibble: 33 x 3## id variable expr## <chr> <chr> <dbl>## 1 Gene 1 WI-6.R1 2.18## 2 Gene 1 WI-6.R2 2.20## 3 Gene 1 WI-6.R4 4.20## 4 Gene 1 WM-6.R1 2.63## 5 Gene 1 WM-6.R2 5.06## 6 Gene 1 WI-12.R1 4.54## 7 Gene 1 WI-12.R2 5.53## 8 Gene 1 WI-12.R4 4.41## 9 Gene 1 WM-12.R1 3.85## 10 Gene 1 WM-12.R2 4.18## # … with 23 more rowsgenes_long## # A tibble: 33 x 3## id variable expr## <chr> <chr> <dbl>## 1 Gene 1 WI-6.R1 2.18## 2 Gene 1 WI-6.R2 2.20## 3 Gene 1 WI-6.R4 4.20## 4 Gene 1 WM-6.R1 2.63## 5 Gene 1 WM-6.R2 5.06## 6 Gene 1 WI-12.R1 4.54## 7 Gene 1 WI-12.R2 5.53## 8 Gene 1 WI-12.R4 4.41## 9 Gene 1 WM-12.R1 3.85## 10 Gene 1 WM-12.R2 4.18## # … with 23 more rowsgenes_long %>% separate(col = variable, into = c("trt", "leftover"), sep = "-")## # A tibble: 33 x 4## id trt leftover expr## <chr> <chr> <chr> <dbl>## 1 Gene 1 WI 6.R1 2.18## 2 Gene 1 WI 6.R2 2.20## 3 Gene 1 WI 6.R4 4.20## 4 Gene 1 WM 6.R1 2.63## 5 Gene 1 WM 6.R2 5.06## 6 Gene 1 WI 12.R1 4.54## 7 Gene 1 WI 12.R2 5.53## 8 Gene 1 WI 12.R4 4.41## 9 Gene 1 WM 12.R1 3.85## 10 Gene 1 WM 12.R2 4.18## # … with 23 more rowsgenes_long_tidy <- genes_long %>% separate(variable, into = c("trt", "leftover"), sep = "-") %>% separate(leftover, into = c("time", "rep"), sep = "\\.")genes_long_tidy## # A tibble: 33 x 5## id trt time rep expr## <chr> <chr> <chr> <chr> <dbl>## 1 Gene 1 WI 6 R1 2.18## 2 Gene 1 WI 6 R2 2.20## 3 Gene 1 WI 6 R4 4.20## 4 Gene 1 WM 6 R1 2.63## 5 Gene 1 WM 6 R2 5.06## 6 Gene 1 WI 12 R1 4.54## 7 Gene 1 WI 12 R2 5.53## 8 Gene 1 WI 12 R4 4.41## 9 Gene 1 WM 12 R1 3.85## 10 Gene 1 WM 12 R2 4.18## # … with 23 more rowsHere is a little data to practice pivot_longer, pivot_wider and separate on.
## # A tibble: 5 x 5## ID koala_NSW koala_VIC bilby_NSW bilby_VIC## <chr> <dbl> <dbl> <dbl> <dbl>## 1 grey 23 43 11 8## 2 cream 56 89 22 17## 3 white 35 72 13 6## 4 black 28 44 19 16## 5 taupe 25 37 21 12koala-bilby.Rmdpivot_longer the data into long form, naming the two new variables, label and countanimal, statepivot_wider the long form data into wide form, where the columns are the states. pivot_wider the long form data into wide form, where the columns are the animals. rude-recliners.Rmd## # A tibble: 3 x 6## V1 `V2:Always` `V2:Usually` `V2:About half the… `V2:Once in a wh… `V2:Never`## <chr> <dbl> <dbl> <dbl> <dbl> <dbl>## 1 No, not r… 124 145 82 116 35## 2 Yes, some… 9 27 35 129 81## 3 Yes, very… 3 3 NA 11 54Answer the following questions in the rude-recliners.Rmd rmarkdown document.
A) What are the variables and observations in this data?
1B) Put the data in tidy long form (using the names V2 as the key variable, and count as the value).
1C) Use the rename function to make the variable names a little shorter.
03:00
Open: tb-incidence.Rmd
Tidy the TB incidence data, using the Rmd to prompt questions.
currency-rates.Rmdrates.csvoz-airport.RmdContains data from the web site Department of Infrastructure, Regional Development and Cities, containing data on Airport Traffic Data 1985–86 to 2017–18.
Read the dataset, into R, naming it passengers
If you are done, place a green sticky on your laptop
Time to take the lab quiz.
pivot_wider and pivot_longer, gather and spread(Not needed to know for the course, but nice to know)
pivot_ functions as spread or gather. These are still valid, but have been improved upon in the latest version of the tidyr package.Lecturer: Nicholas Tierney
Department of Econometrics and Business Statistics
ETC1010.Clayton-x@monash.edu
16th Mar 2020
This work is licensed under a Creative Commons Attribution-NonCommercial-ShareAlike 4.0 International License.
pivot_wider to examine different aspectsgenes_long_tidy %>% pivot_wider( id_cols = c(id, rep, time), names_from = trt, values_from = expr ) %>% ggplot(aes(x = WI, y = WM, colour = id)) + geom_point()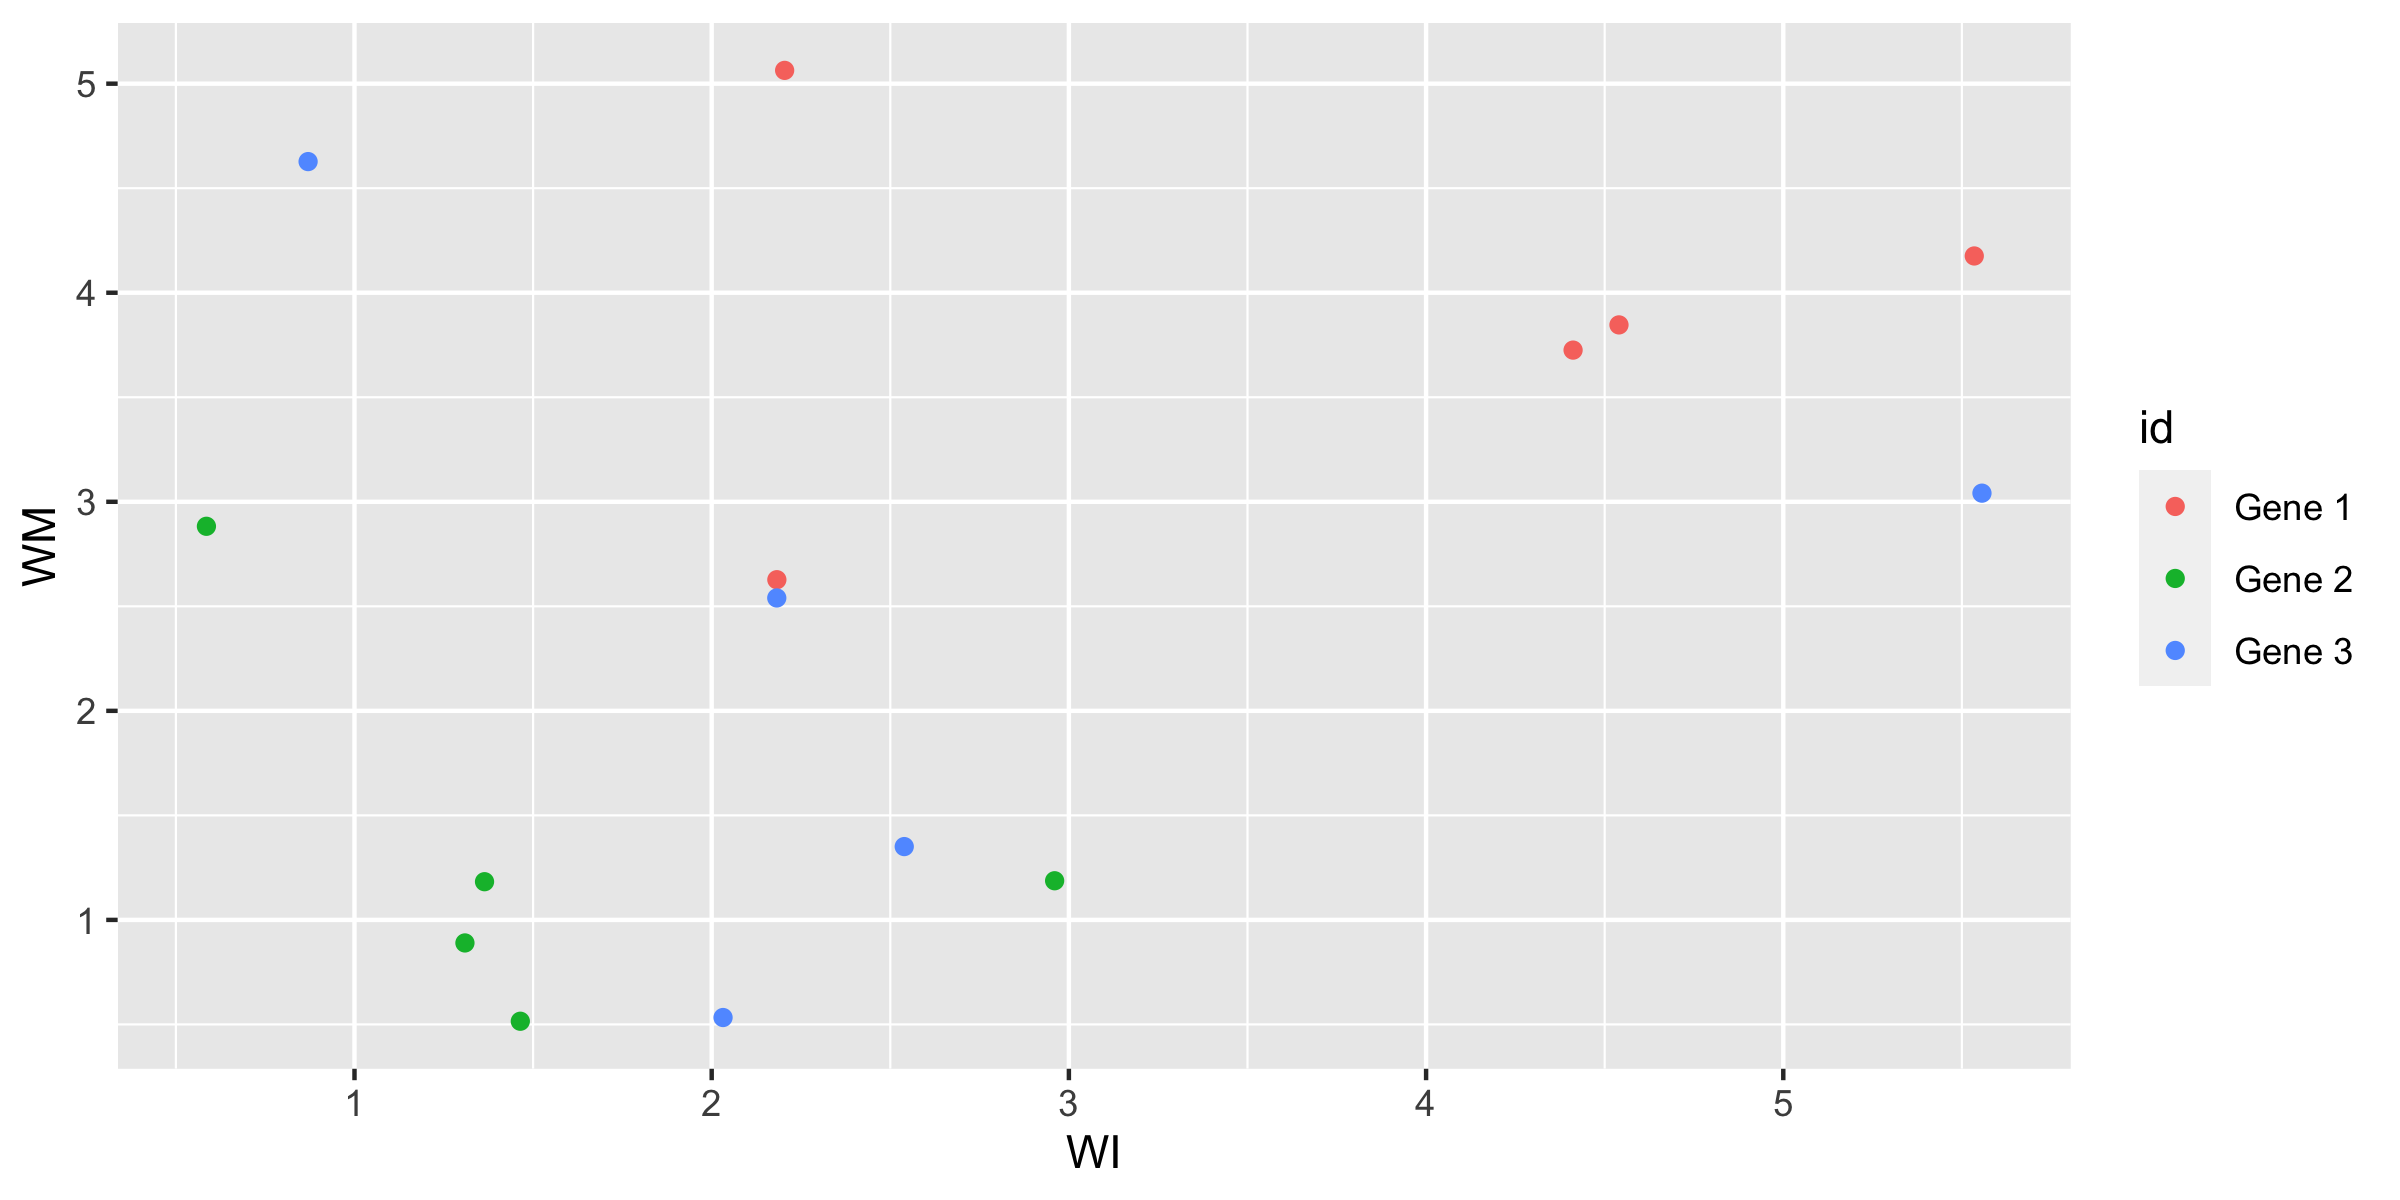
Generally, some negative association within each gene, WM is low if WI is high.
genes_long_tidy %>% pivot_wider(id_cols = c(id, trt, time), names_from = rep, values_from = expr) %>% ggplot(aes(x=R1, y=R4, colour=id)) + geom_point() + coord_equal()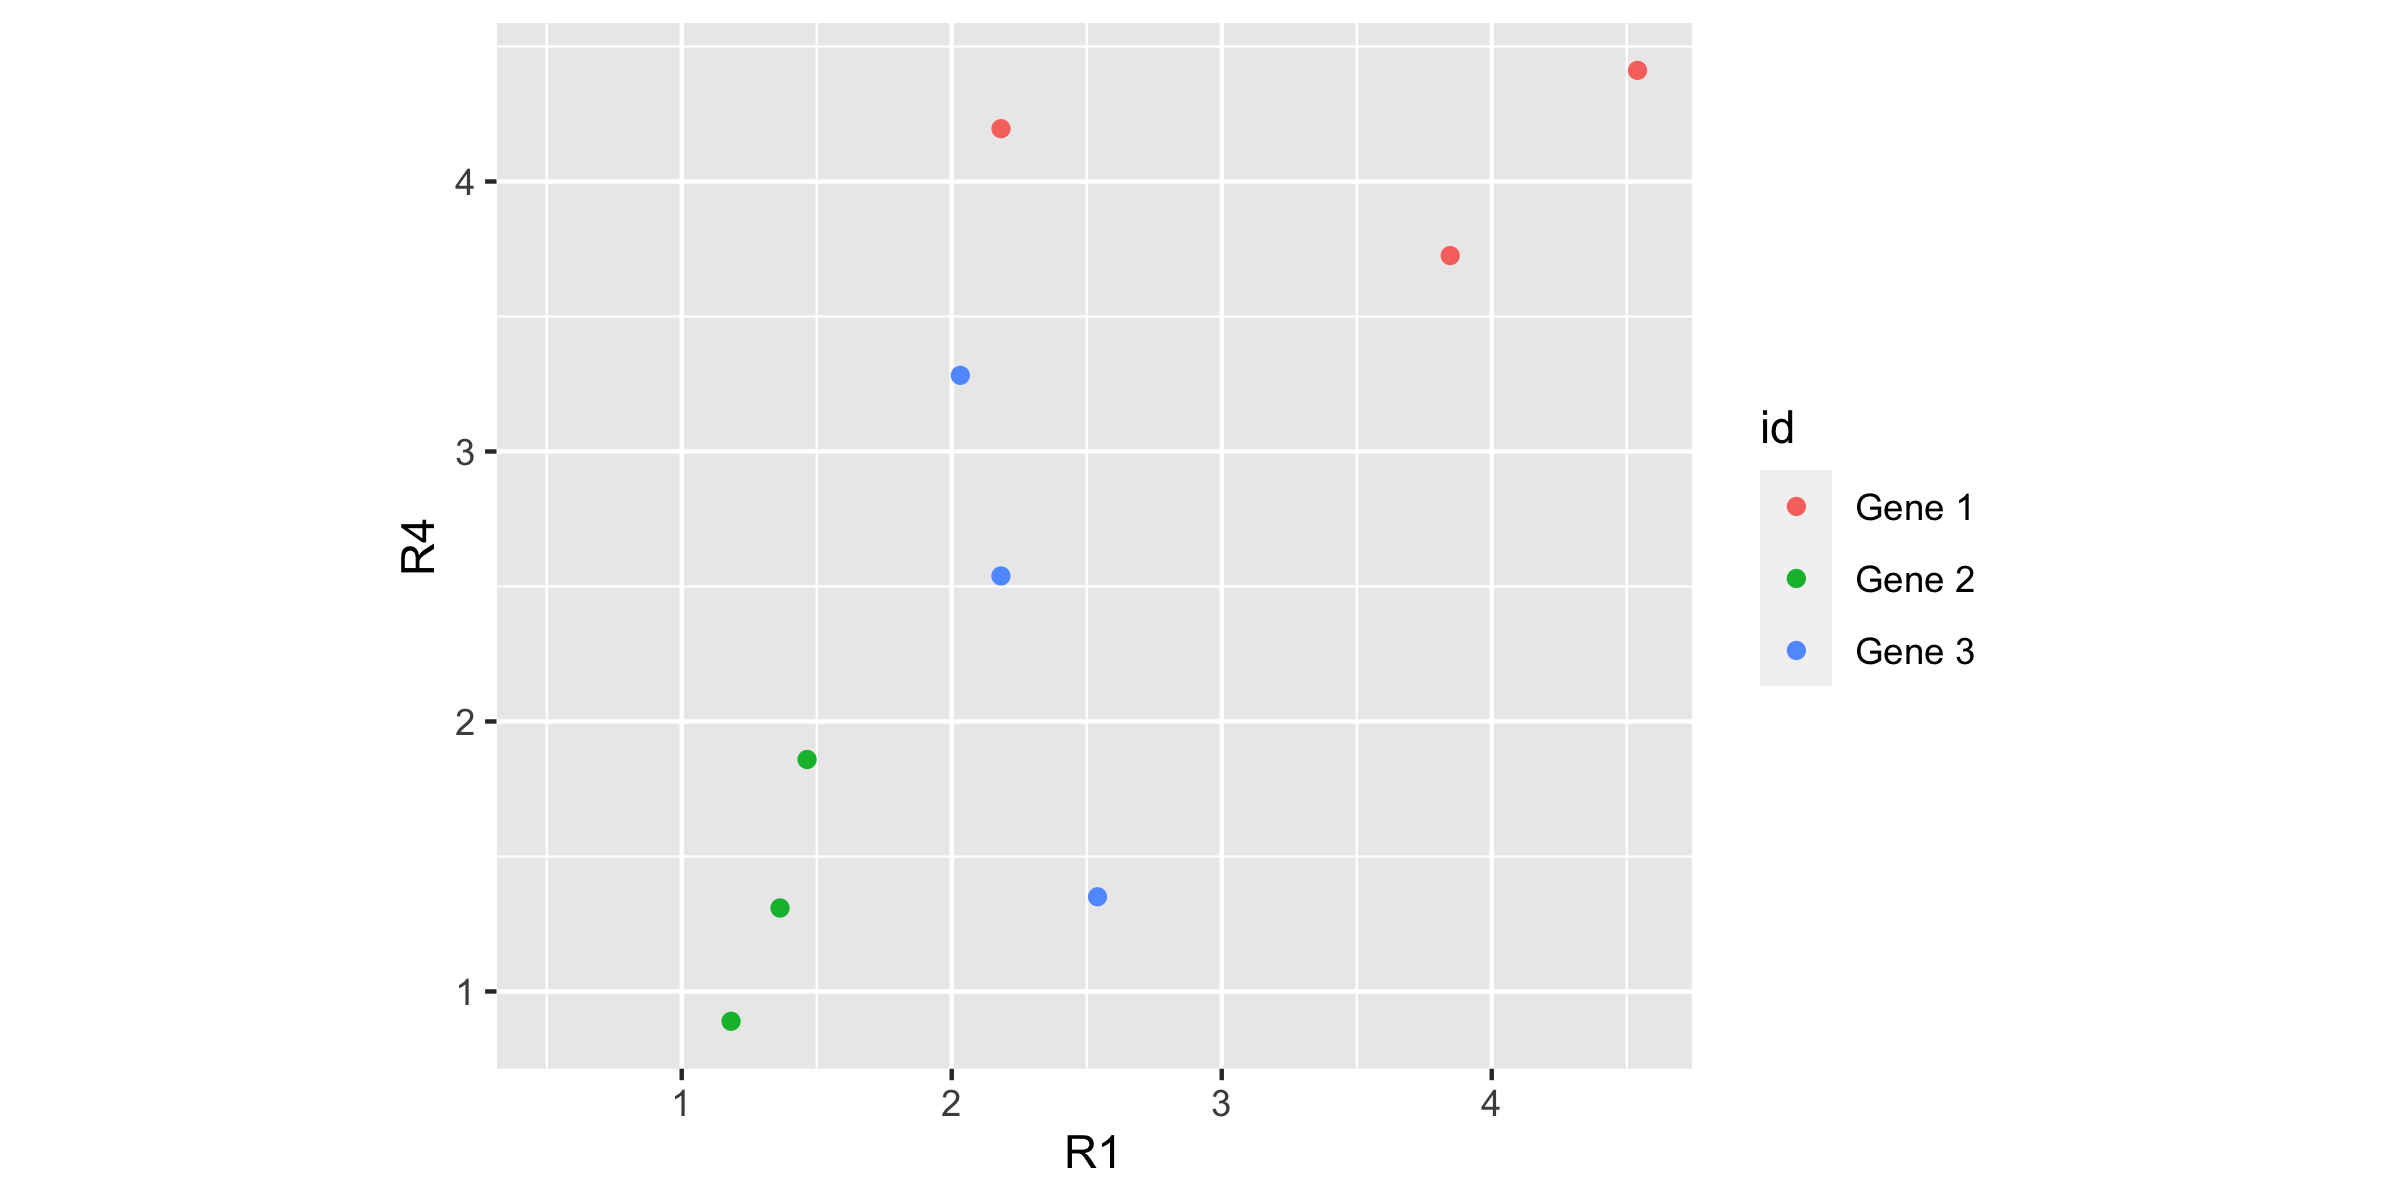
Roughly, replicate 4 is like replicate 1, eg if one is low, the other is low.
That's a good thing, that the replicates are fairly similar.
Lecturer: Nicholas Tierney
Department of Econometrics and Business Statistics
ETC1010.Clayton-x@monash.edu
16th Mar 2020
Keyboard shortcuts
| ↑, ←, Pg Up, k | Go to previous slide |
| ↓, →, Pg Dn, Space, j | Go to next slide |
| Home | Go to first slide |
| End | Go to last slide |
| Number + Return | Go to specific slide |
| b / m / f | Toggle blackout / mirrored / fullscreen mode |
| c | Clone slideshow |
| p | Toggle presenter mode |
| t | Restart the presentation timer |
| ?, h | Toggle this help |
| Esc | Back to slideshow |