ETC1010: Introduction to Data Analysis
Week 2, part B
Week of Tidy Data + Style
Lecturer: Nicholas Tierney
Department of Econometrics and Business Statistics
ETC1010.Clayton-x@monash.edu
11th Mar 2020
Press the right arrow to progress to the next slide!
Lecturer: Nicholas Tierney
Department of Econometrics and Business Statistics
ETC1010.Clayton-x@monash.edu
11th Mar 2020
These will still be posted weekly, but we will give you an extra day or two to complete them
Reading quizzes we expect you to complete before the lecture starts
Lab quizzes require knowledge from the lecture - these need to be completed after the lecture
These will now be delivered online via a link to a zoom meeting, or other online video meeting service

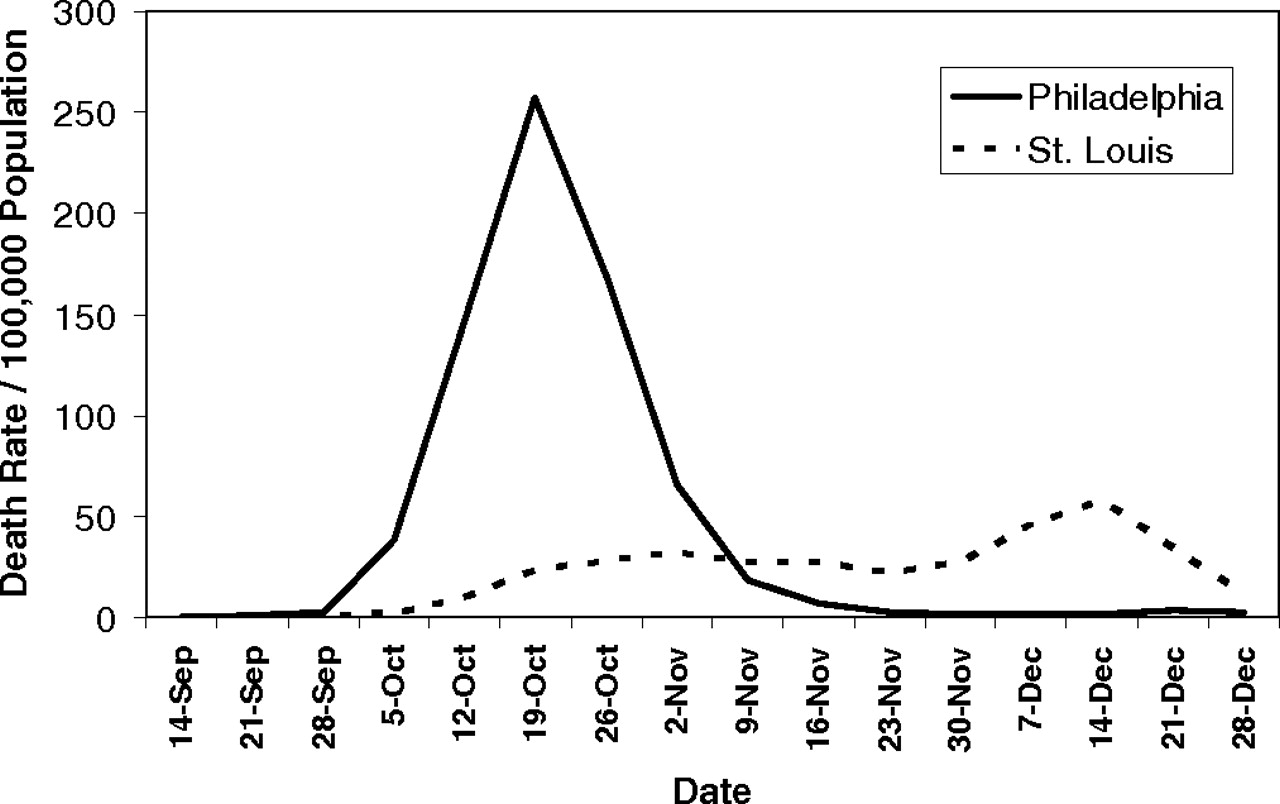
(from (Hatchett et al, 2007))
To brighten things up, here are two youtubers I’ve been watching lately to destress and have “COVID19 free time”
Available now on Ed, "Getting to know our class"
I want to take some time to discuss ideas on learning, and how it ties into the course.
%>%The symbol, %>% is referred to as the "pipe operator"
What you need to know:
data %>% select(age, height, hair_colour) %>% filter(nationality == "australian")"
Use the data, THEN
select the variables (columns), age, height, and hair_colour THEN
filter so nationality is equal to "australian"
"
%>%The symbol, %>% is referred to as the "pipe operator"
What you need to know:
data %>% select(age, height, hair_colour) %>% filter(nationality == "australian")"
Use the data, THEN
select the variables (columns), age, height, and hair_colour THEN
filter so nationality is equal to "australian"
"
That is all you need to know for the moment, but you can read more here
Some common questions you can ask yourself when something isn't working:
"Good coding style is like correct punctuation: you can manage without it, butitsuremakesthingseasiertoread." -- Hadley Wickham
- or _ to separate words# Gooducb-admit.csv# BadUCB Admit.csv_ to separate words in object names# Goodacs_employed# Badacs.employedacs2acs_subsetacs_subsetted_for_males# Goodaverage <- mean(feet / 12 + inches, na.rm = TRUE)# Badaverage<-mean(feet/12+inches,na.rm=TRUE)+# Goodggplot(diamonds, mapping = aes(x = price)) + geom_histogram()# Badggplot(diamonds,mapping=aes(x=price))+geom_histogram()<- not =# Goodx <- 2# Badx = 2Use ", not ', for quoting text. The only exception is when the text already contains double quotes and no single quotes.
ggplot(diamonds, mapping = aes(x = price)) + geom_histogram() + # Good labs(title = "`Shine bright like a diamond`", # Good x = "Diamond prices", # Bad y = 'Frequency')Source: Artwork by @allison_horst
filter()select()mutate()arrange()group_by()summarise()count()Artwork by @allison_horst
avail_pkg <- available.packages()dim(avail_pkg)## [1] 15367 17As of 2020-03-18 there are 15367 R packages available
library(tidyverse)## ── Attaching packages ────────────────────────────────────────────────────────── tidyverse 1.3.0 ──## ✓ ggplot2 3.3.0 ✓ purrr 0.3.3.9000## ✓ tibble 2.1.3 ✓ dplyr 0.8.5 ## ✓ tidyr 1.0.2 ✓ stringr 1.4.0 ## ✓ readr 1.3.1 ✓ forcats 0.5.0## ── Conflicts ───────────────────────────────────────────────────────────── tidyverse_conflicts() ──## x dplyr::filter() masks stats::filter()## x dplyr::group_rows() masks kableExtra::group_rows()## x purrr::is_null() masks testthat::is_null()## x dplyr::lag() masks stats::lag()## x dplyr::matches() masks tidyr::matches(), testthat::matches()The best techniques are available, but there can be conflicts between function names. When you load tidyverse it prints a great summary of conflicts that it knows about, between its functions and others.
For example, there is a filter function in the stats package that comes with the R distribution. This can cause confusion when you want to use the filter function in dplyr (part of tidyverse). To be sure the function you use is the one you want to use, you can prefix it with the package name, dplyr::filter().
This was an actual experiment in Food Sciences at Iowa State University. The goal was to find out if some cheaper oil options could be used to make hot chips: that people would not be able to distinguish the difference between chips fried in the new oils relative to those fried in the current market leader.
Twelve tasters were recruited to sample two chips from each batch, over a period of ten weeks. The same oil was kept for a period of 10 weeks! May be a bit gross by the end!
This data set was brought to R by Hadley Wickham, and was one of the problems that inspired the thinking about tidy data, and the evolution of the tidyverse tools.
Same oil kept for a period of 10 weeks! May be a bit gross!
french_fries <- read_csv("data/french_fries.csv")french_fries## # A tibble: 6 x 9## time treatment subject rep potato buttery grassy rancid painty## <dbl> <dbl> <dbl> <dbl> <dbl> <dbl> <dbl> <dbl> <dbl>## 1 1 1 3 1 2.9 0 0 0 5.5## 2 1 1 3 2 14 0 0 1.1 0 ## 3 1 1 10 1 11 6.4 0 0 0 ## 4 1 1 10 2 9.9 5.9 2.9 2.2 0 ## 5 1 1 15 1 1.2 0.1 0 1.1 5.1## 6 1 1 15 2 8.8 3 3.6 1.5 2.3french_fries <- read_csv("data/french_fries.csv")french_fries## # A tibble: 6 x 9## time treatment subject rep potato buttery grassy rancid painty## <dbl> <dbl> <dbl> <dbl> <dbl> <dbl> <dbl> <dbl> <dbl>## 1 1 1 3 1 2.9 0 0 0 5.5## 2 1 1 3 2 14 0 0 1.1 0 ## 3 1 1 10 1 11 6.4 0 0 0 ## 4 1 1 10 2 9.9 5.9 2.9 2.2 0 ## 5 1 1 15 1 1.2 0.1 0 1.1 5.1## 6 1 1 15 2 8.8 3 3.6 1.5 2.3This data set was brought to R by Hadley Wickham, and was one of the problems that inspired the thinking about tidy data and the tidyverse set of tools
fries_long <- french_fries %>% pivot_longer(cols = potato:painty, names_to = "type", values_to = "rating")fries_longfries_long <- french_fries %>% pivot_longer(cols = potato:painty, names_to = "type", values_to = "rating")fries_long## # A tibble: 3,480 x 6## time treatment subject rep type rating## <dbl> <dbl> <dbl> <dbl> <chr> <dbl>## 1 1 1 3 1 potato 2.9## 2 1 1 3 1 buttery 0 ## 3 1 1 3 1 grassy 0 ## 4 1 1 3 1 rancid 0 ## 5 1 1 3 1 painty 5.5## 6 1 1 3 2 potato 14 ## 7 1 1 3 2 buttery 0 ## 8 1 1 3 2 grassy 0 ## 9 1 1 3 2 rancid 1.1## 10 1 1 3 2 painty 0 ## # … with 3,470 more rowsfries_long## # A tibble: 3,480 x 6## time treatment subject rep type rating## <dbl> <dbl> <dbl> <dbl> <chr> <dbl>## 1 1 1 3 1 potato 2.9## 2 1 1 3 1 buttery 0 ## 3 1 1 3 1 grassy 0 ## 4 1 1 3 1 rancid 0 ## 5 1 1 3 1 painty 5.5## 6 1 1 3 2 potato 14 ## 7 1 1 3 2 buttery 0 ## 8 1 1 3 2 grassy 0 ## 9 1 1 3 2 rancid 1.1## 10 1 1 3 2 painty 0 ## # … with 3,470 more rowsfries_long %>% pivot_wider(names_from = type, values_from = rating)## # A tibble: 696 x 9## time treatment subject rep potato buttery grassy rancid painty## <dbl> <dbl> <dbl> <dbl> <dbl> <dbl> <dbl> <dbl> <dbl>## 1 1 1 3 1 2.9 0 0 0 5.5## 2 1 1 3 2 14 0 0 1.1 0 ## 3 1 1 10 1 11 6.4 0 0 0 ## 4 1 1 10 2 9.9 5.9 2.9 2.2 0 ## 5 1 1 15 1 1.2 0.1 0 1.1 5.1## 6 1 1 15 2 8.8 3 3.6 1.5 2.3## 7 1 1 16 1 9 2.6 0.4 0.1 0.2## 8 1 1 16 2 8.2 4.4 0.3 1.4 4 ## 9 1 1 19 1 7 3.2 0 4.9 3.2## 10 1 1 19 2 13 0 3.1 4.3 10.3## # … with 686 more rowsfilter()choose observations from your data
filter(): examplefries_long %>% filter(subject == 10)## # A tibble: 300 x 6## time treatment subject rep type rating## <dbl> <dbl> <dbl> <dbl> <chr> <dbl>## 1 1 1 10 1 potato 11 ## 2 1 1 10 1 buttery 6.4## 3 1 1 10 1 grassy 0 ## 4 1 1 10 1 rancid 0 ## 5 1 1 10 1 painty 0 ## 6 1 1 10 2 potato 9.9## 7 1 1 10 2 buttery 5.9## 8 1 1 10 2 grassy 2.9## 9 1 1 10 2 rancid 2.2## 10 1 1 10 2 painty 0 ## # … with 290 more rowsfilter(): detailsFiltering requires comparison to find the subset of observations of interest. What do you think the following mean?
subject != 10 x > 10 x >= 10 class %in% c("A", "B") !is.na(y)03:00
filter(): detailssubject != 10
filter(): detailssubject != 10
Find rows corresponding to all subjects except subject 10
filter(): detailssubject != 10
Find rows corresponding to all subjects except subject 10
x > 10
filter(): detailssubject != 10
Find rows corresponding to all subjects except subject 10
x > 10
find all rows where variable x has values bigger than 10
x >= 10
filter(): detailssubject != 10
Find rows corresponding to all subjects except subject 10
x > 10
find all rows where variable x has values bigger than 10
x >= 10
finds all rows variable x is greater than or equal to 10.
class %in% c("A", "B")
filter(): detailssubject != 10
Find rows corresponding to all subjects except subject 10
x > 10
find all rows where variable x has values bigger than 10
x >= 10
finds all rows variable x is greater than or equal to 10.
class %in% c("A", "B")
finds all rows where variable class is either A or B
!is.na(y)
finds all rows that DO NOT have a missing value for variable y
Filter the french fries data to have:
fries_long %>% filter(time == 1)## # A tibble: 360 x 6## time treatment subject rep type rating## <dbl> <dbl> <dbl> <dbl> <chr> <dbl>## 1 1 1 3 1 potato 2.9## 2 1 1 3 1 buttery 0 ## 3 1 1 3 1 grassy 0 ## 4 1 1 3 1 rancid 0 ## 5 1 1 3 1 painty 5.5## 6 1 1 3 2 potato 14 ## 7 1 1 3 2 buttery 0 ## 8 1 1 3 2 grassy 0 ## 9 1 1 3 2 rancid 1.1## 10 1 1 3 2 painty 0 ## # … with 350 more rowsfries_long %>% filter(treatment == 1)## # A tibble: 1,160 x 6## time treatment subject rep type rating## <dbl> <dbl> <dbl> <dbl> <chr> <dbl>## 1 1 1 3 1 potato 2.9## 2 1 1 3 1 buttery 0 ## 3 1 1 3 1 grassy 0 ## 4 1 1 3 1 rancid 0 ## 5 1 1 3 1 painty 5.5## 6 1 1 3 2 potato 14 ## 7 1 1 3 2 buttery 0 ## 8 1 1 3 2 grassy 0 ## 9 1 1 3 2 rancid 1.1## 10 1 1 3 2 painty 0 ## # … with 1,150 more rowsfries_long %>% filter(treatment != 2)## # A tibble: 2,320 x 6## time treatment subject rep type rating## <dbl> <dbl> <dbl> <dbl> <chr> <dbl>## 1 1 1 3 1 potato 2.9## 2 1 1 3 1 buttery 0 ## 3 1 1 3 1 grassy 0 ## 4 1 1 3 1 rancid 0 ## 5 1 1 3 1 painty 5.5## 6 1 1 3 2 potato 14 ## 7 1 1 3 2 buttery 0 ## 8 1 1 3 2 grassy 0 ## 9 1 1 3 2 rancid 1.1## 10 1 1 3 2 painty 0 ## # … with 2,310 more rowsfries_long %>% filter(time %in% c("1", "2", "3", "4"))## # A tibble: 1,440 x 6## time treatment subject rep type rating## <dbl> <dbl> <dbl> <dbl> <chr> <dbl>## 1 1 1 3 1 potato 2.9## 2 1 1 3 1 buttery 0 ## 3 1 1 3 1 grassy 0 ## 4 1 1 3 1 rancid 0 ## 5 1 1 3 1 painty 5.5## 6 1 1 3 2 potato 14 ## 7 1 1 3 2 buttery 0 ## 8 1 1 3 2 grassy 0 ## 9 1 1 3 2 rancid 1.1## 10 1 1 3 2 painty 0 ## # … with 1,430 more rows%in%[demo]
select()select()select(): a comma separated list of variables, by name.french_fries %>% select(time, treatment, subject)## # A tibble: 696 x 3## time treatment subject## <dbl> <dbl> <dbl>## 1 1 1 3## 2 1 1 3## 3 1 1 10## 4 1 1 10## 5 1 1 15## 6 1 1 15## 7 1 1 16## 8 1 1 16## 9 1 1 19## 10 1 1 19## # … with 686 more rowsselect(): drop selected variables by prefixing with -select(): drop selected variables by prefixing with -french_fries %>% select(-time, -treatment, -subject)## # A tibble: 696 x 6## rep potato buttery grassy rancid painty## <dbl> <dbl> <dbl> <dbl> <dbl> <dbl>## 1 1 2.9 0 0 0 5.5## 2 2 14 0 0 1.1 0 ## 3 1 11 6.4 0 0 0 ## 4 2 9.9 5.9 2.9 2.2 0 ## 5 1 1.2 0.1 0 1.1 5.1## 6 2 8.8 3 3.6 1.5 2.3## 7 1 9 2.6 0.4 0.1 0.2## 8 2 8.2 4.4 0.3 1.4 4 ## 9 1 7 3.2 0 4.9 3.2## 10 2 13 0 3.1 4.3 10.3## # … with 686 more rowsselect()Inside select() you can use text-matching of the names like starts_with(), ends_with(), contains(), matches(), or everything()
select()Inside select() you can use text-matching of the names like starts_with(), ends_with(), contains(), matches(), or everything()
french_fries %>% select(contains("e"))## # A tibble: 696 x 5## time treatment subject rep buttery## <dbl> <dbl> <dbl> <dbl> <dbl>## 1 1 1 3 1 0 ## 2 1 1 3 2 0 ## 3 1 1 10 1 6.4## 4 1 1 10 2 5.9## 5 1 1 15 1 0.1## 6 1 1 15 2 3 ## 7 1 1 16 1 2.6## 8 1 1 16 2 4.4## 9 1 1 19 1 3.2## 10 1 1 19 2 0 ## # … with 686 more rowsselect(): Using itYou can use the colon, :, to choose variables in order of the columns
select(): Using itYou can use the colon, :, to choose variables in order of the columns
french_fries %>% select(time:subject)## # A tibble: 696 x 3## time treatment subject## <dbl> <dbl> <dbl>## 1 1 1 3## 2 1 1 3## 3 1 1 10## 4 1 1 10## 5 1 1 15## 6 1 1 15## 7 1 1 16## 8 1 1 16## 9 1 1 19## 10 1 1 19## # … with 686 more rowsselect() time, treatment and repselect() subject through to rating03:00
Artwork by @allison_horst
mutate(): create a new variable; keep existing onesfrench_fries ## # A tibble: 696 x 9## time treatment subject rep potato buttery grassy rancid painty## <dbl> <dbl> <dbl> <dbl> <dbl> <dbl> <dbl> <dbl> <dbl>## 1 1 1 3 1 2.9 0 0 0 5.5## 2 1 1 3 2 14 0 0 1.1 0 ## 3 1 1 10 1 11 6.4 0 0 0 ## 4 1 1 10 2 9.9 5.9 2.9 2.2 0 ## 5 1 1 15 1 1.2 0.1 0 1.1 5.1## 6 1 1 15 2 8.8 3 3.6 1.5 2.3## 7 1 1 16 1 9 2.6 0.4 0.1 0.2## 8 1 1 16 2 8.2 4.4 0.3 1.4 4 ## 9 1 1 19 1 7 3.2 0 4.9 3.2## 10 1 1 19 2 13 0 3.1 4.3 10.3## # … with 686 more rowsmutate(): create a new variable; keep existing onesfrench_fries %>% mutate(rainty = rancid + painty)## # A tibble: 696 x 10## time treatment subject rep potato buttery grassy rancid painty rainty## <dbl> <dbl> <dbl> <dbl> <dbl> <dbl> <dbl> <dbl> <dbl> <dbl>## 1 1 1 3 1 2.9 0 0 0 5.5 5.5 ## 2 1 1 3 2 14 0 0 1.1 0 1.1 ## 3 1 1 10 1 11 6.4 0 0 0 0 ## 4 1 1 10 2 9.9 5.9 2.9 2.2 0 2.2 ## 5 1 1 15 1 1.2 0.1 0 1.1 5.1 6.20## 6 1 1 15 2 8.8 3 3.6 1.5 2.3 3.8 ## 7 1 1 16 1 9 2.6 0.4 0.1 0.2 0.3 ## 8 1 1 16 2 8.2 4.4 0.3 1.4 4 5.4 ## 9 1 1 19 1 7 3.2 0 4.9 3.2 8.1 ## 10 1 1 19 2 13 0 3.1 4.3 10.3 14.6 ## # … with 686 more rowsCompute a new variable called lrating by taking a log of the rating
02:00
summarise(): boil data down to one row observationfries_long## # A tibble: 6 x 6## time treatment subject rep type rating## <dbl> <dbl> <dbl> <dbl> <chr> <dbl>## 1 1 1 3 1 potato 2.9## 2 1 1 3 1 buttery 0 ## 3 1 1 3 1 grassy 0 ## 4 1 1 3 1 rancid 0 ## 5 1 1 3 1 painty 5.5## 6 1 1 3 2 potato 14summarise(): boil data down to one row observationfries_long## # A tibble: 6 x 6## time treatment subject rep type rating## <dbl> <dbl> <dbl> <dbl> <chr> <dbl>## 1 1 1 3 1 potato 2.9## 2 1 1 3 1 buttery 0 ## 3 1 1 3 1 grassy 0 ## 4 1 1 3 1 rancid 0 ## 5 1 1 3 1 painty 5.5## 6 1 1 3 2 potato 14fries_long %>% summarise(rating = mean(rating, na.rm = TRUE))## # A tibble: 1 x 1## rating## <dbl>## 1 3.16type?type?use group_by()
summarise() + group_by()Produce summaries for every group:
fries_long %>% group_by(type) %>% summarise(rating = mean(rating, na.rm=TRUE))## # A tibble: 5 x 2## type rating## <chr> <dbl>## 1 buttery 1.82 ## 2 grassy 0.664## 3 painty 2.52 ## 4 potato 6.95 ## 5 rancid 3.8503:00
fries_long %>% group_by(subject) %>% summarise(rating = mean(rating, na.rm=TRUE))## # A tibble: 12 x 2## subject rating## <dbl> <dbl>## 1 3 2.46## 2 10 4.24## 3 15 2.16## 4 16 3.00## 5 19 4.54## 6 31 4.00## 7 51 4.39## 8 52 2.72## 9 63 3.48## 10 78 1.94## 11 79 1.94## 12 86 2.94fries_long %>% filter(type == "rancid") %>% group_by(time) %>% summarise(rating = mean(rating, na.rm=TRUE))## # A tibble: 10 x 2## time rating## <dbl> <dbl>## 1 1 2.36## 2 2 2.85## 3 3 3.72## 4 4 3.60## 5 5 3.53## 6 6 4.08## 7 7 3.89## 8 8 4.27## 9 9 4.67## 10 10 6.07arrange(): orders data by a given variable.arrange(): orders data by a given variable.Useful for display of results (but there are other uses!)
fries_long %>% group_by(type) %>% summarise(rating = mean(rating, na.rm=TRUE)) ## # A tibble: 5 x 2## type rating## <chr> <dbl>## 1 buttery 1.82 ## 2 grassy 0.664## 3 painty 2.52 ## 4 potato 6.95 ## 5 rancid 3.85arrange()fries_long %>% group_by(type) %>% summarise(rating = mean(rating, na.rm=TRUE)) %>% arrange(rating)## # A tibble: 5 x 2## type rating## <chr> <dbl>## 1 grassy 0.664## 2 buttery 1.82 ## 3 painty 2.52 ## 4 rancid 3.85 ## 5 potato 6.9502:00
arrange() answersfries_long %>% group_by(type) %>% summarise(rating = mean(rating, na.rm=TRUE)) %>% arrange(desc(rating))## # A tibble: 5 x 2## type rating## <chr> <dbl>## 1 potato 6.95 ## 2 rancid 3.85 ## 3 painty 2.52 ## 4 buttery 1.82 ## 5 grassy 0.664arrange() answersfries_long %>% group_by(subject) %>% summarise(rating = mean(rating, na.rm=TRUE)) %>% arrange(rating)## # A tibble: 12 x 2## subject rating## <dbl> <dbl>## 1 78 1.94## 2 79 1.94## 3 15 2.16## 4 3 2.46## 5 52 2.72## 6 86 2.94## 7 16 3.00## 8 63 3.48## 9 31 4.00## 10 10 4.24## 11 51 4.39## 12 19 4.54count() the number of things in a given columnfries_long %>% count(type, sort = TRUE)## # A tibble: 5 x 2## type n## <chr> <int>## 1 buttery 696## 2 grassy 696## 3 painty 696## 4 potato 696## 5 rancid 696count()02:00
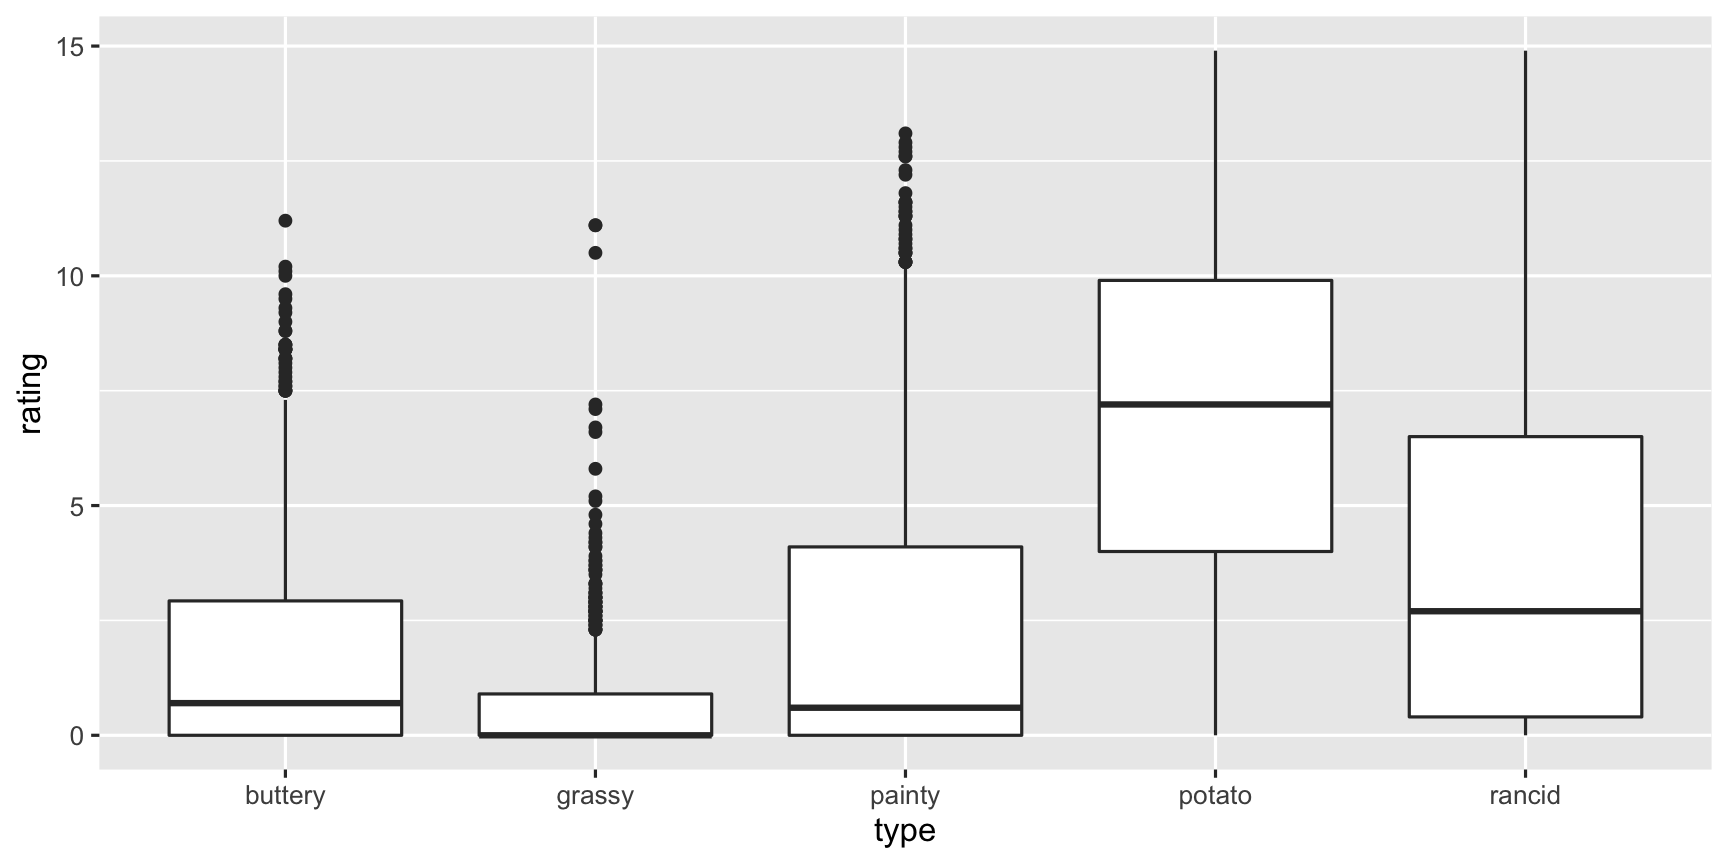
fries_long %>% group_by(type) %>% summarise( m = mean(rating, na.rm = TRUE), sd = sd(rating, na.rm = TRUE)) %>% arrange(-m)## # A tibble: 5 x 3## type m sd## <chr> <dbl> <dbl>## 1 potato 6.95 3.58## 2 rancid 3.85 3.78## 3 painty 2.52 3.39## 4 buttery 1.82 2.41## 5 grassy 0.664 1.32fries_long %>% group_by(type) %>% summarise( m = mean(rating, na.rm = TRUE), sd = sd(rating, na.rm = TRUE)) %>% arrange(-m)## # A tibble: 5 x 3## type m sd## <chr> <dbl> <dbl>## 1 potato 6.95 3.58## 2 rancid 3.85 3.78## 3 painty 2.52 3.39## 4 buttery 1.82 2.41## 5 grassy 0.664 1.32The scales of the ratings are quite different. Mostly the chips are rated highly on potato'y, but low on grassy.
ggplot(fries_long, aes(x = type, y = rating)) + geom_boxplot()
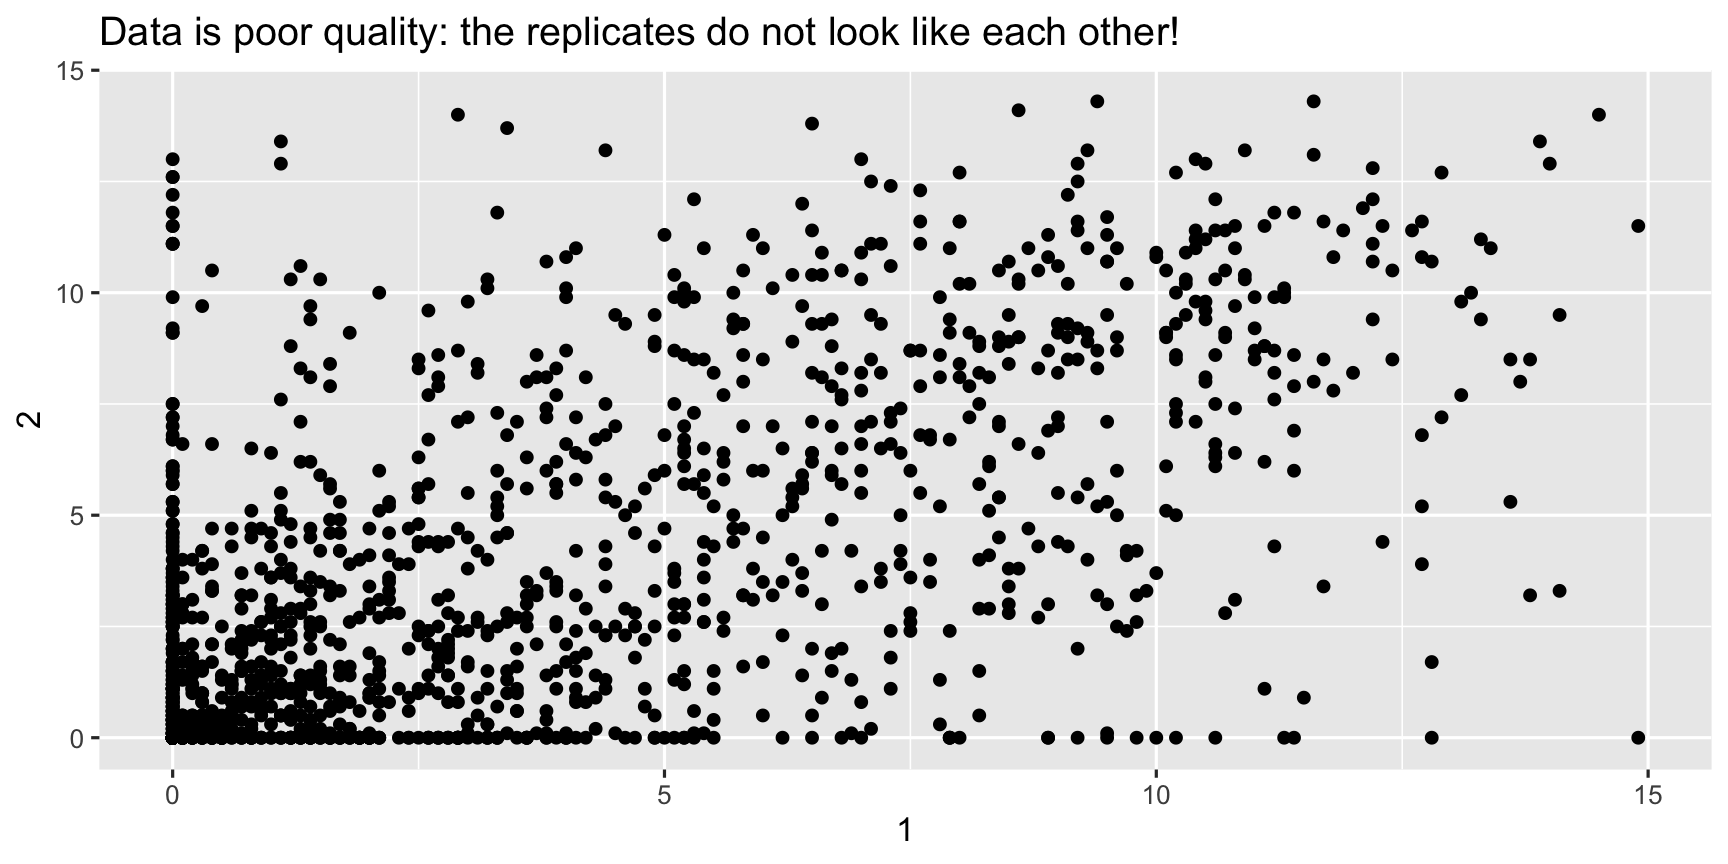
fries_spread <- fries_long %>% pivot_wider(names_from = rep, values_from = rating)fries_spread## # A tibble: 1,740 x 6## time treatment subject type `1` `2`## <dbl> <dbl> <dbl> <chr> <dbl> <dbl>## 1 1 1 3 potato 2.9 14 ## 2 1 1 3 buttery 0 0 ## 3 1 1 3 grassy 0 0 ## 4 1 1 3 rancid 0 1.1## 5 1 1 3 painty 5.5 0 ## 6 1 1 10 potato 11 9.9## 7 1 1 10 buttery 6.4 5.9## 8 1 1 10 grassy 0 2.9## 9 1 1 10 rancid 0 2.2## 10 1 1 10 painty 0 0 ## # … with 1,730 more rowssummarise(fries_spread, r = cor(`1`, `2`, use = "complete.obs"))## # A tibble: 1 x 1## r## <dbl>## 1 0.668 ggplot(fries_spread, aes(x = `1`, y = `2`)) + geom_point() + labs(title = "Data is poor quality: the replicates do not look like each other!")
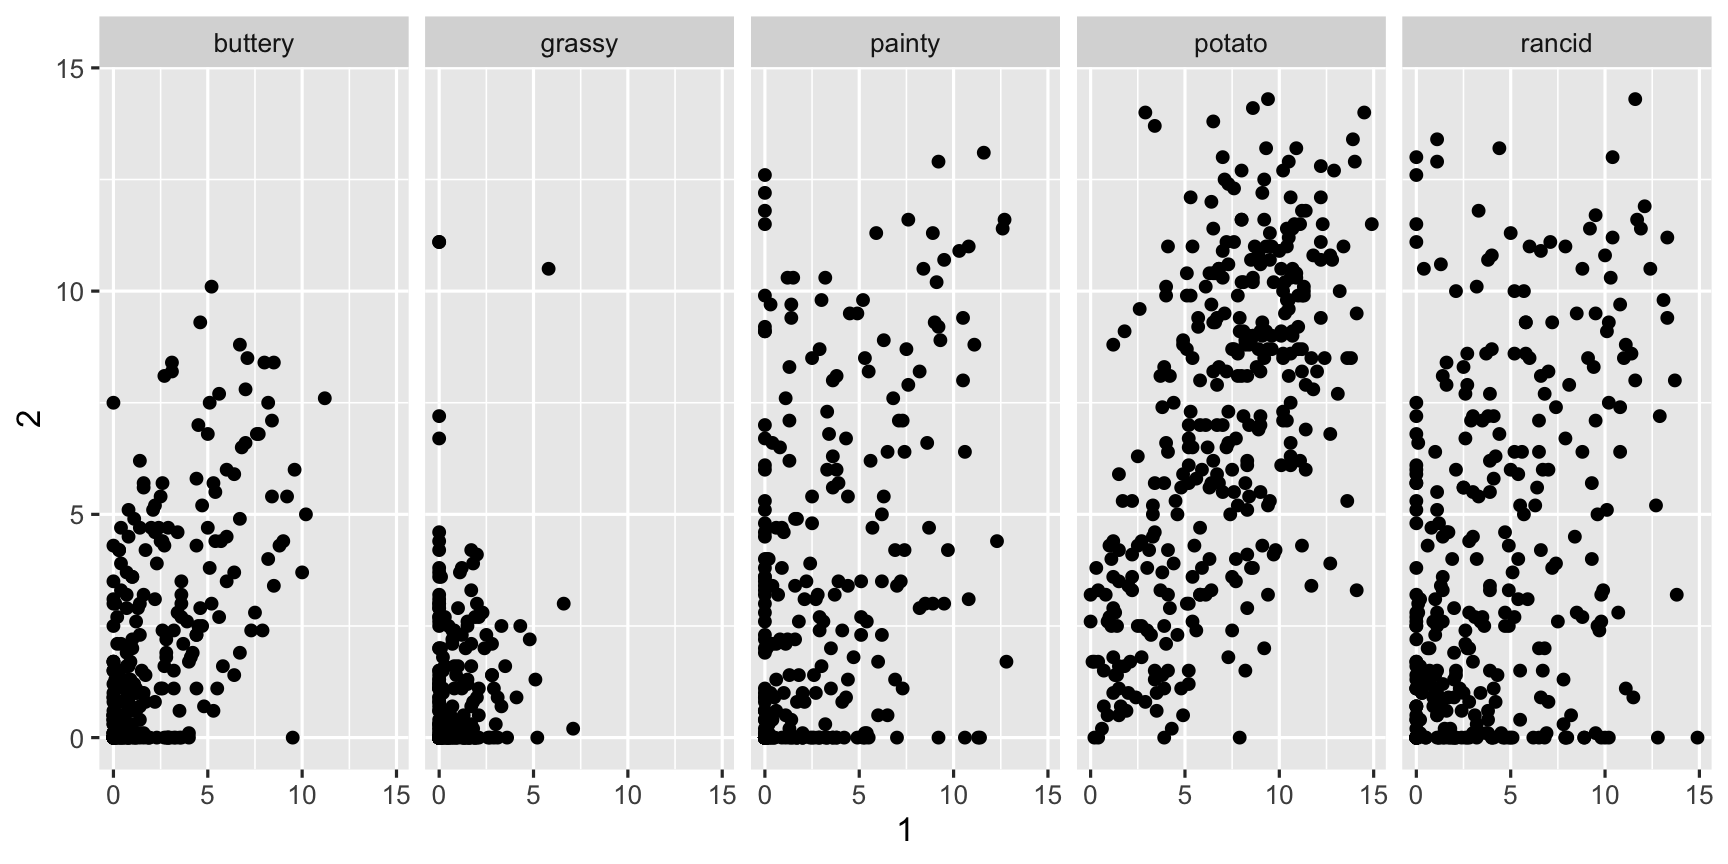
fries_spread %>% group_by(type) %>% summarise(r = cor(x = `1`, y = `2`, use = "complete.obs"))## # A tibble: 5 x 2## type r## <chr> <dbl>## 1 buttery 0.650## 2 grassy 0.239## 3 painty 0.479## 4 potato 0.616## 5 rancid 0.391ggplot(fries_spread, aes(x=`1`, y=`2`)) + geom_point() + facet_wrap(~type, ncol = 5)
ggplot(fries_spread, aes(x=`1`, y=`2`)) + geom_point() + facet_wrap(~type, ncol = 5)
Potato'y and buttery have better replication than the other scales, but there is still a lot of variation from rep 1 to 2.
" ', nothing, or backtick?" ', nothing, or backtick?Example:
fries_long %>% pivot_wider(names_from = type, values_from = rating)vs
french_fries %>% pivot_longer(cols = potato:painty, names_to = "type", values_to = "rating")" ', nothing, or backtick?Variables with unusual names (starting with numbers, spaces, or containing special characters like !@#$%^&*()- need to be referenced with backticks:
data %>% select(`name with spaces`)Open pisa.Rmd on rstudio cloud.
It will be launched later today
When is the assignment due?
How do I complete the assignment?
I don't have a group / I can't get in contact with my group
How do I stay in touch with my group?
How do I submit the assignment?
Time to take the lab quiz.
Lecturer: Nicholas Tierney
Department of Econometrics and Business Statistics
ETC1010.Clayton-x@monash.edu
11th Mar 2020
Keyboard shortcuts
| ↑, ←, Pg Up, k | Go to previous slide |
| ↓, →, Pg Dn, Space, j | Go to next slide |
| Home | Go to first slide |
| End | Go to last slide |
| Number + Return | Go to specific slide |
| b / m / f | Toggle blackout / mirrored / fullscreen mode |
| c | Clone slideshow |
| p | Toggle presenter mode |
| t | Restart the presentation timer |
| ?, h | Toggle this help |
| Esc | Back to slideshow |