ETC1010: Introduction to Data Analysis
Week 4, part B
Advanced topics in data visualisation
Lecturer: Nicholas Tierney
Department of Econometrics and Business Statistics
ETC1010.Clayton-x@monash.edu
April 2020
Press the right arrow to progress to the next slide!
Lecturer: Nicholas Tierney
Department of Econometrics and Business Statistics
ETC1010.Clayton-x@monash.edu
April 2020
Draw a mental model / concept map of last lectures content on joins.
We want to plot life expectancy vs income, but there's a problem:
gap_life_au## # A tibble: 9 x 3## country year life_expectancy## <chr> <dbl> <dbl>## 1 Australia 2012 82.5## 2 Australia 2013 82.6## 3 Australia 2014 82.5## 4 Australia 2015 82.5## 5 Australia 2016 82.5## 6 Australia 2017 82.4## 7 Australia 2018 82.5## 8 Australia 2019 82.7## 9 Australia 2020 82.8gap_income_au## # A tibble: 9 x 3## country year gdp## <chr> <dbl> <dbl>## 1 Australia 2012 42800## 2 Australia 2013 43200## 3 Australia 2014 43700## 4 Australia 2015 44100## 5 Australia 2016 44600## 6 Australia 2017 44900## 7 Australia 2018 45400## 8 Australia 2019 45500## 9 Australia 2020 45800We could try bind_cols(), to bind dataframes columns together
bind_cols(gap_life_au, gap_income_au)## # A tibble: 9 x 6## country year life_expectancy country1 year1 gdp## <chr> <dbl> <dbl> <chr> <dbl> <dbl>## 1 Australia 2012 82.5 Australia 2012 42800## 2 Australia 2013 82.6 Australia 2013 43200## 3 Australia 2014 82.5 Australia 2014 43700## 4 Australia 2015 82.5 Australia 2015 44100## 5 Australia 2016 82.5 Australia 2016 44600## 6 Australia 2017 82.4 Australia 2017 44900## 7 Australia 2018 82.5 Australia 2018 45400## 8 Australia 2019 82.7 Australia 2019 45500## 9 Australia 2020 82.8 Australia 2020 45800## # A tibble: 9 x 6## country year life_expectancy country1 year1 gdp## <chr> <dbl> <dbl> <chr> <dbl> <dbl>## 1 Australia 2012 82.5 Australia 2012 42800## 2 Australia 2013 82.6 Australia 2013 43200## 3 Australia 2014 82.5 Australia 2014 43700## 4 Australia 2015 82.5 Australia 2015 44100## 5 Australia 2016 82.5 Australia 2016 44600## 6 Australia 2017 82.4 Australia 2017 44900## 7 Australia 2018 82.5 Australia 2018 45400## 8 Australia 2019 82.7 Australia 2019 45500## 9 Australia 2020 82.8 Australia 2020 45800For example, how do we add this co2 data to income or life?
gap_co2_au## # A tibble: 3 x 3## country year co2## <chr> <dbl> <dbl>## 1 Australia 2012 17 ## 2 Australia 2013 16.1## 3 Australia 2014 15.4We can't use bind_cols()
bind_cols(gap_co2_au, gap_income_au)Error: Argument 2 must be length 3, not 9We can't use bind_cols()
bind_cols(gap_co2_au, gap_income_au)Error: Argument 2 must be length 3, not 9We could think about a more complex approach using filter, and so on...
We can't use bind_cols()
bind_cols(gap_co2_au, gap_income_au)Error: Argument 2 must be length 3, not 9We could think about a more complex approach using filter, and so on...
But surely this must be a problem that we encounter in data analysis?
We can't use bind_cols()
bind_cols(gap_co2_au, gap_income_au)Error: Argument 2 must be length 3, not 9We could think about a more complex approach using filter, and so on...
But surely this must be a problem that we encounter in data analysis?
Someone must have thought of a solution to this before?
We can't use bind_cols()
bind_cols(gap_co2_au, gap_income_au)Error: Argument 2 must be length 3, not 9We could think about a more complex approach using filter, and so on...
But surely this must be a problem that we encounter in data analysis?
Someone must have thought of a solution to this before?
They did! Joins!
We can use left_join() to combine the income and life expectancy data
left_join(x = gap_income_au, y = gap_life_au, by = c("country", "year"))## # A tibble: 9 x 4## country year gdp life_expectancy## <chr> <dbl> <dbl> <dbl>## 1 Australia 2012 42800 82.5## 2 Australia 2013 43200 82.6## 3 Australia 2014 43700 82.5## 4 Australia 2015 44100 82.5## 5 Australia 2016 44600 82.5## 6 Australia 2017 44900 82.4## 7 Australia 2018 45400 82.5## 8 Australia 2019 45500 82.7## 9 Australia 2020 45800 82.8We get missings for co2, because we don't have c02 values for 2015 and beyond.
left_join(x = gap_income_au, y = gap_life_au, by = c("country", "year")) %>% left_join(gap_co2_au, by = c("country", "year"))## # A tibble: 9 x 5## country year gdp life_expectancy co2## <chr> <dbl> <dbl> <dbl> <dbl>## 1 Australia 2012 42800 82.5 17 ## 2 Australia 2013 43200 82.6 16.1## 3 Australia 2014 43700 82.5 15.4## 4 Australia 2015 44100 82.5 NA ## 5 Australia 2016 44600 82.5 NA ## 6 Australia 2017 44900 82.4 NA ## 7 Australia 2018 45400 82.5 NA ## 8 Australia 2019 45500 82.7 NA ## 9 Australia 2020 45800 82.8 NAgap_au <- left_join(x = gap_income_au, y = gap_life_au, by = c("country", "year")) %>% left_join(gap_co2_au, by = c("country", "year"))gap_au## # A tibble: 9 x 5## country year gdp life_expectancy co2## <chr> <dbl> <dbl> <dbl> <dbl>## 1 Australia 2012 42800 82.5 17 ## 2 Australia 2013 43200 82.6 16.1## 3 Australia 2014 43700 82.5 15.4## 4 Australia 2015 44100 82.5 NA ## 5 Australia 2016 44600 82.5 NA ## 6 Australia 2017 44900 82.4 NA ## 7 Australia 2018 45400 82.5 NA ## 8 Australia 2019 45500 82.7 NA ## 9 Australia 2020 45800 82.8 NAggplot(gap_au, aes(x = gdp, y = life_expectancy)) + geom_point()
open "joins.Rmd"
Discuss with your partner why these two joins produce different results?
left_join(gap_co2_au, gap_life_au)## # A tibble: 3 x 4## country year co2 life_expectancy## <chr> <dbl> <dbl> <dbl>## 1 Australia 2012 17 82.5## 2 Australia 2013 16.1 82.6## 3 Australia 2014 15.4 82.5left_join(gap_life_au, gap_co2_au)## # A tibble: 9 x 4## country year life_expectancy co2## <chr> <dbl> <dbl> <dbl>## 1 Australia 2012 82.5 17 ## 2 Australia 2013 82.6 16.1## 3 Australia 2014 82.5 15.4## 4 Australia 2015 82.5 NA ## 5 Australia 2016 82.5 NA ## 6 Australia 2017 82.4 NA ## 7 Australia 2018 82.5 NA ## 8 Australia 2019 82.7 NA ## 9 Australia 2020 82.8 NAWhat happens when we add data from New Zealand into the mix?
How can you join that data together?
There are three main types of colour palette:
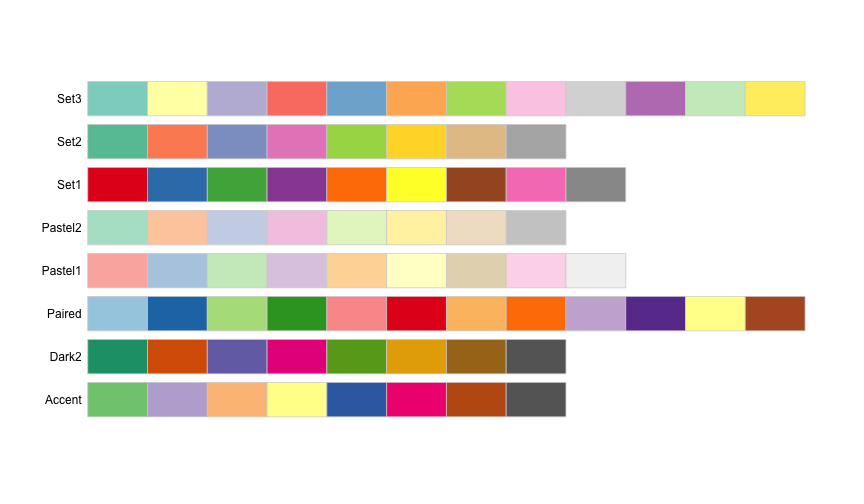
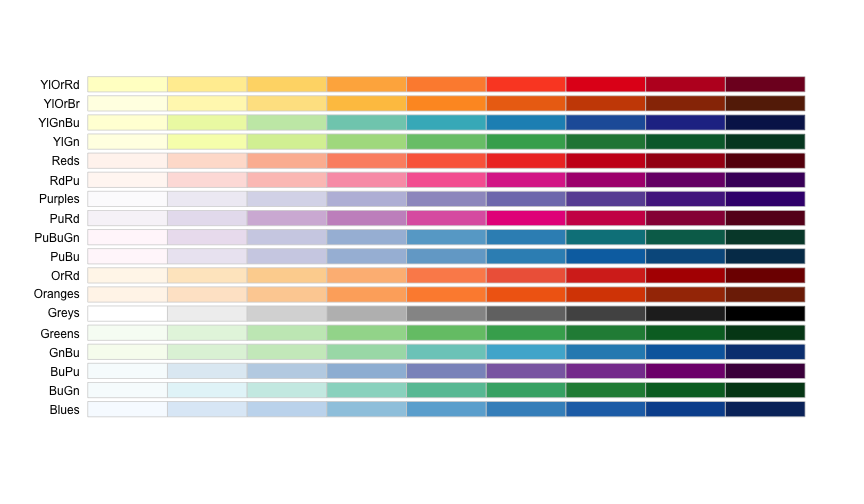
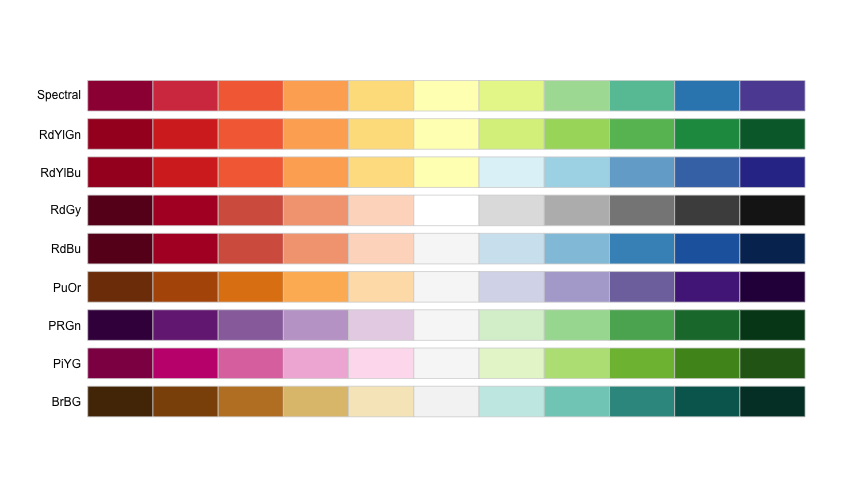
## # A tibble: 157,820 x 5## country year count gender age ## <chr> <dbl> <dbl> <chr> <chr>## 1 Afghanistan 1980 NA m 04 ## 2 Afghanistan 1981 NA m 04 ## 3 Afghanistan 1982 NA m 04 ## 4 Afghanistan 1983 NA m 04 ## 5 Afghanistan 1984 NA m 04 ## 6 Afghanistan 1985 NA m 04 ## 7 Afghanistan 1986 NA m 04 ## 8 Afghanistan 1987 NA m 04 ## 9 Afghanistan 1988 NA m 04 ## 10 Afghanistan 1989 NA m 04 ## # … with 157,810 more rows## # A tibble: 219 x 4## country `2002` `2012` reldif## <chr> <dbl> <dbl> <dbl>## 1 Afghanistan 6509 13907 1.14 ## 2 Albania 225 185 -0.178 ## 3 Algeria 8246 7510 -0.0893## 4 American Samoa 1 0 -1 ## 5 Andorra 2 2 0 ## 6 Angola 17988 22106 0.229 ## 7 Anguilla 0 0 0 ## 8 Antigua and Barbuda 4 1 -0.75 ## 9 Argentina 5383 4787 -0.111 ## 10 Armenia 511 316 -0.382 ## # … with 209 more rowsggplot(tb_map) + geom_polygon(aes(x = long, y = lat, group = group, fill = reldif)) + theme_map()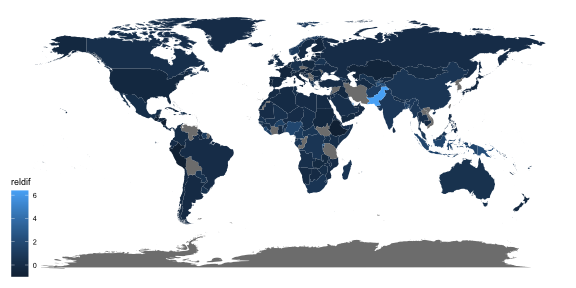
library(viridis)ggplot(tb_map) + geom_polygon(aes(x = long, y = lat, group = group, fill = reldif)) + theme_map() + scale_fill_viridis(na.value = "white")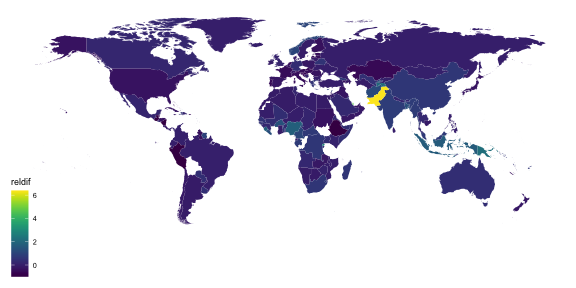
ggplot(tb_map) + geom_polygon(aes(x = long, y = lat, group = group, fill = reldif)) + theme_map() + scale_fill_distiller(palette = "PRGn", na.value = "white", limits = c(-7, 7))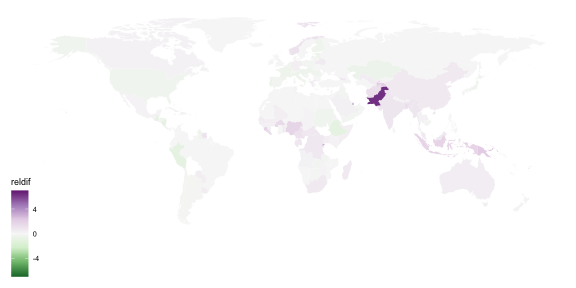
viridis, and scico.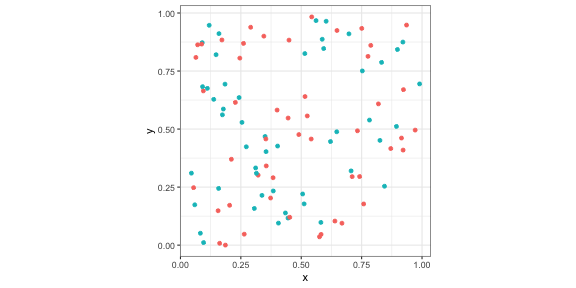
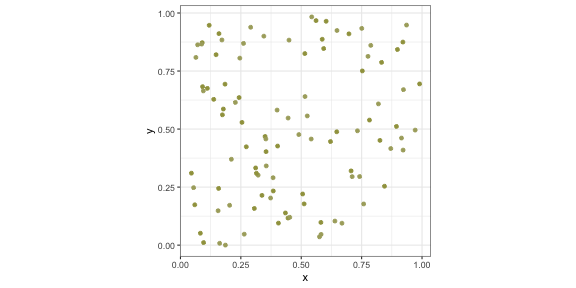
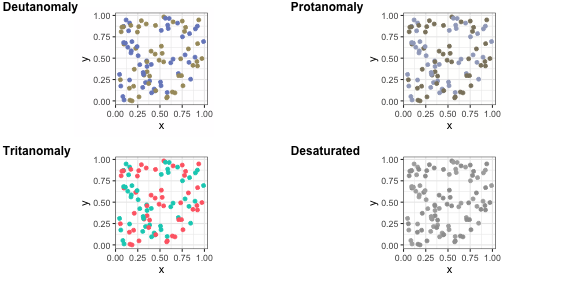
p2 <- p + scale_colour_brewer(palette = "Dark2")p2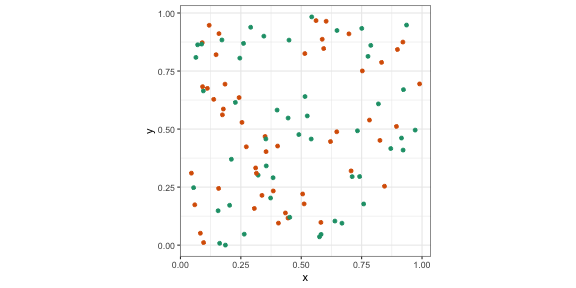
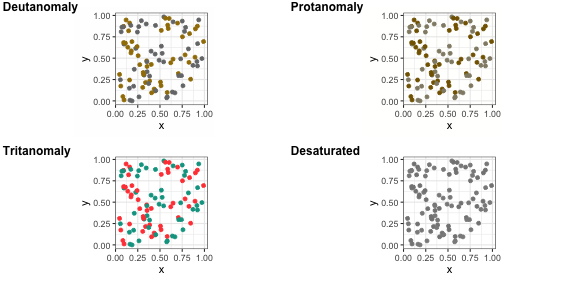
p3 <- p + scale_colour_viridis_d()p3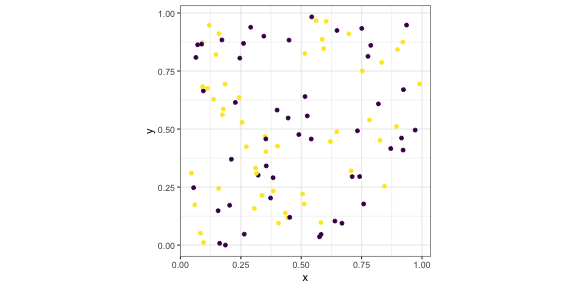
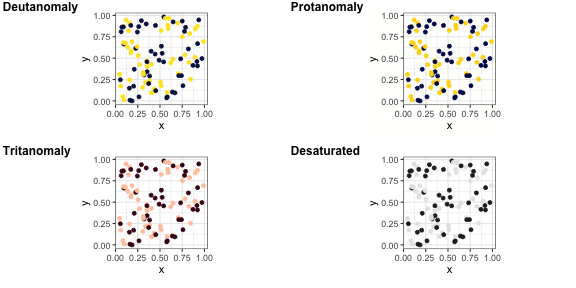
+ scale_colour_viridis()+ scale_colour_brewer(palette = "Dark2")scico R package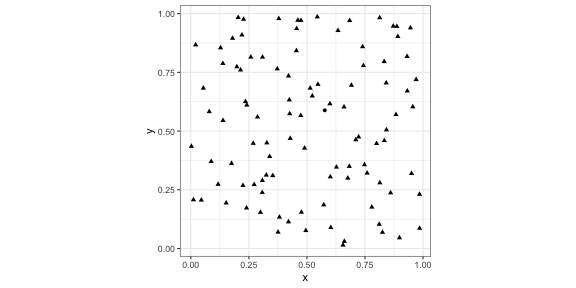
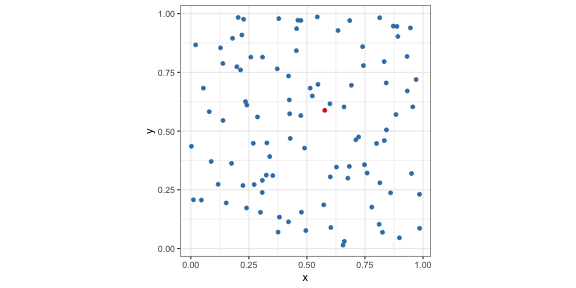
Basic rule: place the groups that you want to compare close to each other


Here are two different arrangements of the tb data. To answer the question "Is the incidence similar for males and females in 2012 across age groups?" the first arrangement is better. It puts males and females right beside each other, so the relative heights of the bars can be seen quickly. The answer to the question would be "No, the numbers were similar in youth, but males are more affected with increasing age."
The second arrangement puts the focus on age groups, and is better to answer the question "Is the incidence similar for age groups in 2012, across gender?" To which the answer would be "No, among females, the incidence is higher at early ages. For males, the incidence is much more uniform across age groups."


geom_point()ggplot(df, aes(x = x, y = y1)) + geom_point()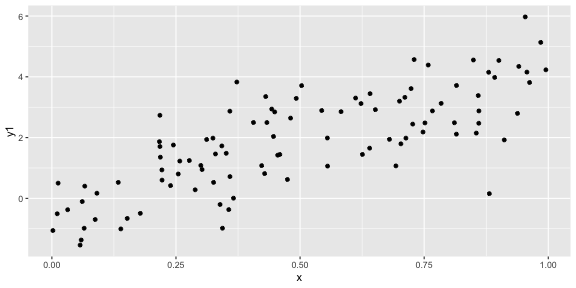
geom_smooth(method = "lm", se = FALSE)ggplot(df, aes(x = x, y = y1)) + geom_point() + geom_smooth(method = "lm", se = FALSE)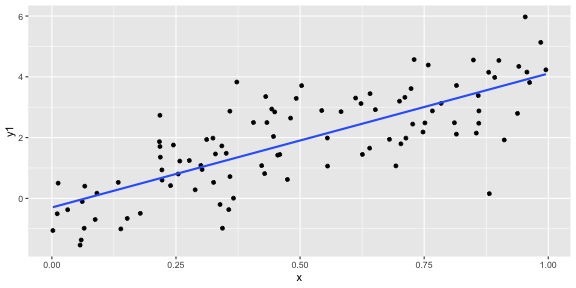
geom_smooth(method = "lm")ggplot(df, aes(x = x, y = y1)) + geom_point() + geom_smooth(method = "lm")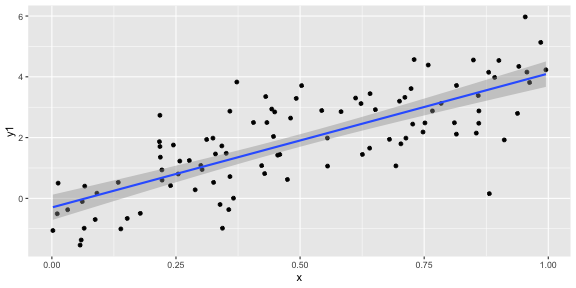
geom_point()ggplot(df, aes(x = x, y = y2)) + geom_point()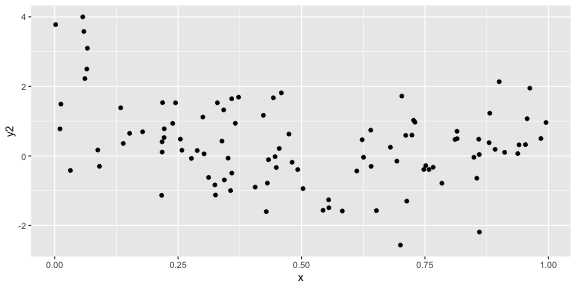
geom_smooth(method = "lm", se = FALSE)ggplot(df, aes(x = x, y = y2)) + geom_point() + geom_smooth(method = "lm", se = FALSE)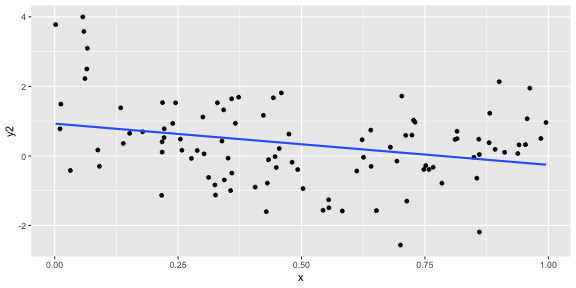
geom_smooth(se = FALSE)
ggplot(df, aes(x = x, y = y2)) + geom_point() + geom_smooth(se = FALSE)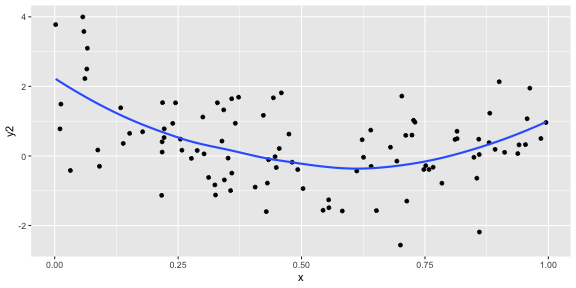
geom_smooth(se = FALSE, span = 0.05)
ggplot(df, aes(x = x, y = y2)) + geom_point() + geom_smooth(se = FALSE, span = 0.05)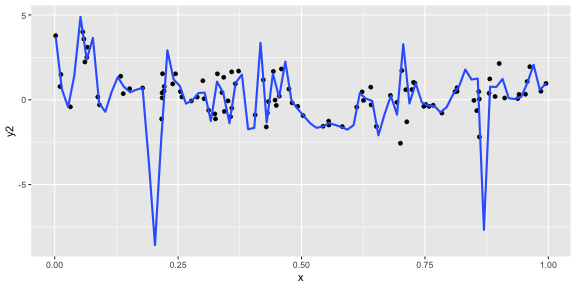
geom_smooth(se = FALSE, span = 0.2)p1 <- ggplot(df, aes(x = x, y = y2)) + geom_point() + geom_smooth(se = FALSE, span = 0.2)p1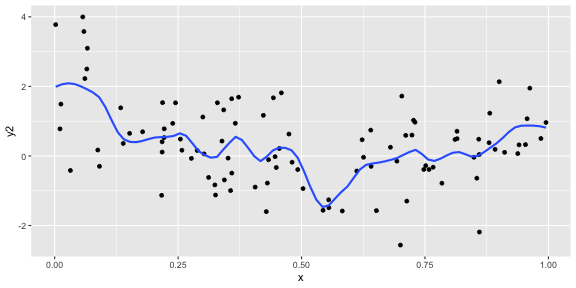
library(plotly)ggplotly(p1)p <- ggplot(mtcars) + geom_point(aes(x = wt, y = mpg, colour = factor(gear))) + facet_wrap(~am)p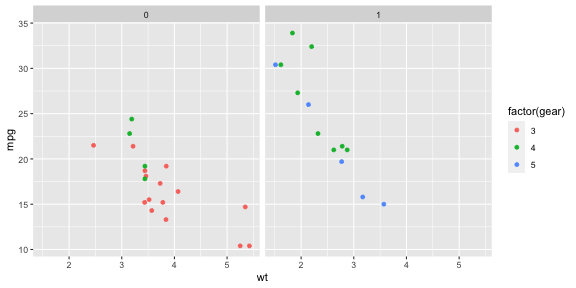
p + theme_minimal()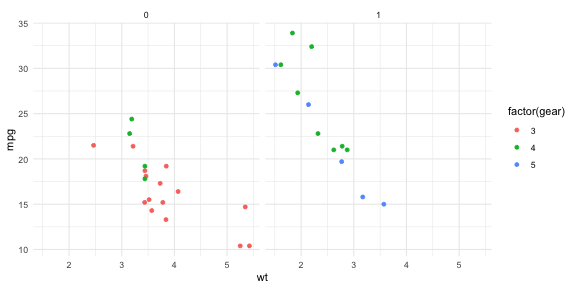
theme_few()p + theme_few() + scale_colour_few()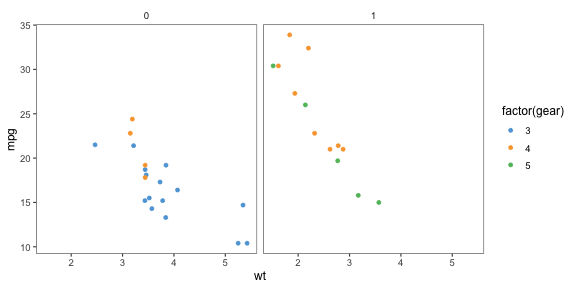
theme_excel() 😷p + theme_excel() + scale_colour_excel()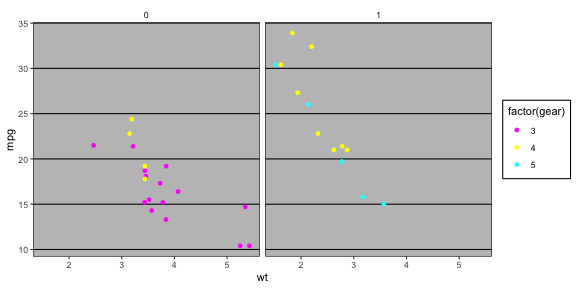
library(wesanderson)p + scale_colour_manual( values = wes_palette("Royal1") )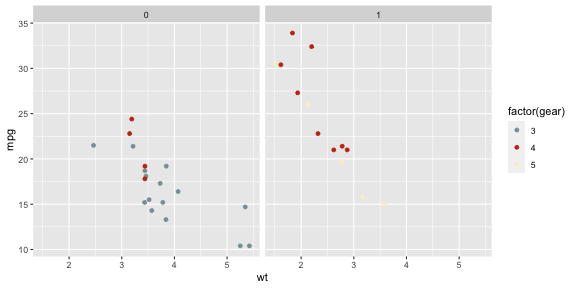
ggthemes package has many different styles for the plots. xkcd, skittles, wesanderson, beyonce, ochre, ....# install.packages("usethis")library(usethis)use_course("https://ida.numbat.space/exercises/4b/ida-exercise-4b.zip")Lecturer: Nicholas Tierney
Department of Econometrics and Business Statistics
ETC1010.Clayton-x@monash.edu
April 2020
Keyboard shortcuts
| ↑, ←, Pg Up, k | Go to previous slide |
| ↓, →, Pg Dn, Space, j | Go to next slide |
| Home | Go to first slide |
| End | Go to last slide |
| Number + Return | Go to specific slide |
| b / m / f | Toggle blackout / mirrored / fullscreen mode |
| c | Clone slideshow |
| p | Toggle presenter mode |
| t | Restart the presentation timer |
| ?, h | Toggle this help |
| Esc | Back to slideshow |